


INTRODUCTION
Pressure injury, also called pressure ulcer or pressure sore, is defined as localized cellular necrosis caused by constant compression between external materials and bony prominences. The severity of pressure injury varies from erythema to tissue destruction. The National Pressure Injury Advisory Panel (NPUAP) defines a 4-stage classification system as follows: Stage 1, non-blanchable erythema of intact skin; Stage 2, partial-thickness skin loss involving epidermis or dermis, such as abrasion, blister, or shallow crater; Stage 3, full-thickness skin loss involving damage or necrosis of subcutaneous tissue; and Stage 4, full-thickness skin loss with extensive destruction, tissue necrosis, and damage to muscle, bone, and supporting structures [1].
Perioperative patients are at risk of developing pressure injuries since anesthetic agents interrupt normal relaxation and contraction of blood vessels and reduce perfusion at the site of the bony prominence. The patient’s surgical position is another factor that increases incidence of pressure injury, as anatomical structures such as nerves, muscles, and tendons are extended or compressed for a long period, which interferes with capillary perfusion. The incidence varies from 3.7% to 23.8% [2,3] in surgical patients, which may depend on the patients’ characteristics (age, comorbidities, etc.), type of surgery, injury stage, and time after surgery when the injury was discovered .
Previous literature have typically reported stage 2 pressure injuries or higher as these injuries are associated with bacterial infections, osteomyelitis, and squamous cell carcinoma and contribute to increased mortality [4]. However, stage 1 pressure injury should not be overlooked as it may lead to patient discomfort, pain, prolonged hospital stay, and subsequent pressure ulcer development [5,6]. Although surgical factors, such as type of procedure and positioning, are important factors associated with pressure injury, most previous studies did not focus on a specific type of surgery or surgical position. In our clinical experience, pressure injuries more frequently occurred in patients undergoing spinal surgery than in patients undergoing other surgeries. Spinal surgeries are mostly performed in a prone position, and many of them are for spinal fusion, which usually cause a considerable amount of bleeding and are associated with prolonged surgery duration, which are associated with the known perioperative risk factors for pressure injury. To date, very few studies have been conducted on pressure injury in spinal surgery; additionally, analysis of the risk factors associated with pressure injury have shown inconclusive results.
Moreover, previous studies have mostly included the injury found immediately after surgery as well as the injuries that were discovered during the postoperative period of 24 h to several months. To minimize the postoperative effect and analyze only the intraoperative factors, it is necessary to limit the study to injuries found immediately after surgery.
The relatively high incidence of pressure injury reported so far indicates that risk assessment and the use of protective measures should be improved [7]. Additionally, the literature shows that approximately 95% of all pressure injuries in perioperative patients can be prevented with early risk assessment and appropriate interventions [8]. Therefore, it is important to particularly target reversible factors through prior risk assessment for the patient group with a high risk of pressure injury. This study aimed to identify the incidence of perioperative pressure injury during spinal surgery and explore the perioperative risk factors that may potentially contribute to pressure injury.
MATERIALS AND METHODS
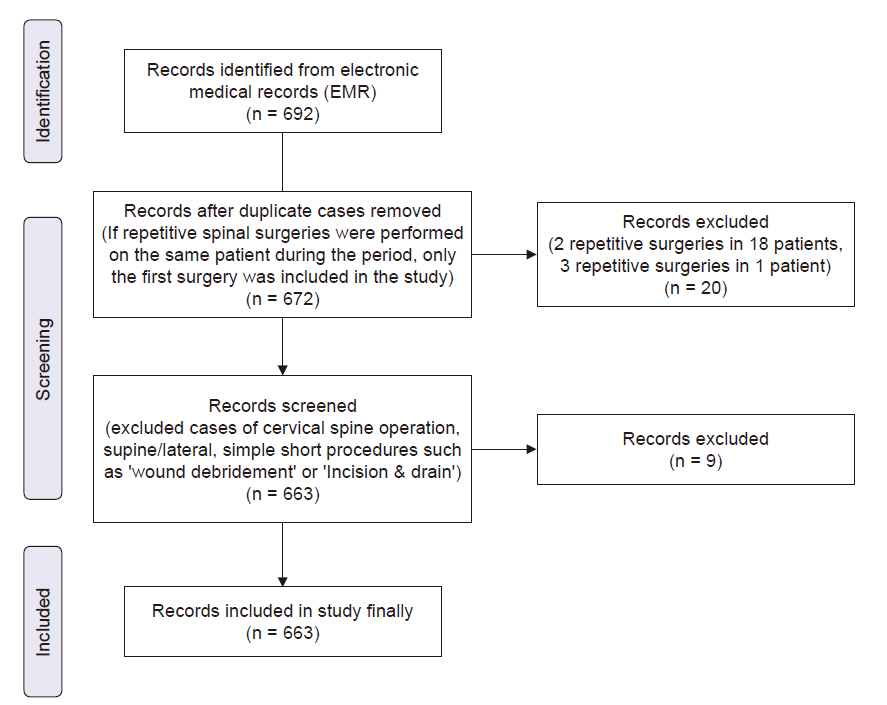
This study analyzed the data of 692 patients who underwent spinal surgery from March 2016 to May 2018 at a single university teaching hospital. Ethical approval from the Institutional Review Board (IRB no. 2019-08-004) was received. Data were retrospectively analyzed from the database of the institution's electronic medical records (EMR).
There were 20 duplicate cases in the initial data preparation stage, which were duplicated due to reoperation two (18 patients) and three times (1 patient) in the same patient, and repeat surgery by the same person may introduce a bias against the risk of pressure injury. In all cases, only the first spinal surgery was included in the analysis.
Patients aged 18 years and older, of both sexes, undergoing elective or emergency spinal surgeries were included in the study. We excluded 9 cases of cervical spine operation, supine/lateral position, simple short procedures such as ‘wound debridement’ or ‘incision & drain.’ Ultimately, 663 patients were included in the study (Fig. 1).
Outcome and risk factor evaluation
The primary outcome was the occurrence of pressure injury. Attending anesthesiologists, surgeons, and scrub nurses examined the patient’s whole body before and after the surgery. The injury site, size, and characteristics of the pressure injury were obtained from the description in the EMR. We categorized the pressure injuries into 4 stages according to the NPUAP classification system [1].
Potential risk factors for pressure injury were selected based on previous studies and expert opinions. The authors first considered the common and known risk factors, obtained from previous studies of risk assessment for pressure injury [2,3,9-11]. These commonly known risk factors can classified into three categories: preoperative, intraoperative, and postoperative factors. We focused on the preoperative and intraoperative factors that might be mediated by an anesthesiologist to prevent pressure injury.
We explored the following characteristics as preoperative risk factors for pressure injury: demographic data (age, sex, body mass index), current status regarding smoking/alcohol consumption, history or presence of various comorbidities (cardiovascular, respiratory, renal, hepatic, diabetes, malignancy, and neurologic disease), preoperative laboratory test results (hemoglobin, hematocrit, protein, albumin, glucose, blood urea nitrogen, creatinine, sodium, potassium, etc.), and American Society of Anesthesiologists classification.
Additionally, intraoperative risk factors consisted of anesthesia duration, total amount of intraoperative fluid administration, total amount of all intraoperative blood product transfusion, total amount of intraoperative bleeding, average body temperature during surgery, and the total dose of vasopressor agent administered. These risk factors were selected based on consensus among experts and surgeons on the likelihood of these factors affecting the development of a pressure injury [10].
Statistical analysis
All statistical analyses were performed using R software (version 3.6.1, R Foundation for Statistical Computing, Austria; https://www.R-project.org/). We compared the clinical characteristics between the pressure injury group and the non-injury group using a Student’s t-test or Mann-Whitney U test for continuous variables based on the results of a Shapiro-Wilk normality test, and we used a Fisher’s exact test or chi-square test for categorical or proportional variables.
A multivariable logistic regression analysis based on a binomial generalized linear model was performed to identify the risk factors associated with perioperative pressure injury. We explored the relationship between each variable and the pressure injury through a univariate logistic regression analysis, and then performed multivariable logistic regression, which consisted of variables with P < 0.1 from the univariate logistic regression. Independent risk factors with P < 0.05 in the multivariable analysis were considered statistically significant. To produce the final logistic regression model, the risk factors were selected by weighting their clinical implications and statistical values (e.g., Akaike Information Criterion). Hosmer-Lemeshow goodness-of-fit tests were used to assess the fitness of the logistic regression model. The optimal cut-off point of the explored risk factor was determined by maximizing the sum of sensitivity and specificity using a receiver operating characteristic (ROC) curve to measure association and evaluate the prediction accuracy of a significant risk factor for the occurrence of pressure injury.
RESULTS
All results are expressed as mean ± standard deviation or median (interquartile range; 1Q, 3Q) as appropriate. The incidence of all stages of pressure injury was 5.9% (39/663). All patients had a relatively low stage of pressure injury; nine patients (18%) had stage-1 and 40 patients (82%) had stage-2 injuries, while none had a stage-3 injury or higher. Eight patients had two different sites of injuries, and one patient had three different sites of injuries. The face and inguinal regions were the most injured sites (both 28.6%). Other sites, in order of frequency of injury occurrence, included the following: chest (24.5%), anterior superior iliac spine (6.1%), abdomen (6.1%), arm (4.1%), and femur (2.1%) (Table 1).
Table 2 shows a comparison of the general characteristics of patients from the pressure injury and non-pressure injury groups. These characteristics include factors that could potentially be considered as risk factors for pressure injury, general physiological information of the patient, and the characteristics related to the patient's surgical outcome, such as total duration of hospital stay.
The pressure injury group showed a 13% longer hospitalization period and a 3% lower protein plasma concentration than the non-pressure injury group. There were a total of 3 (7.7%) cases of malignancy in the pressure injury group, which included solid tumors in organs such as the prostate, uterus, and lung. They also had 25% longer surgery time and larger volumes of fluid and blood product than the other group. Intraoperative bleeding was also 20% higher than that of the non-pressure injury group (Table 2).
Table 3 presents the results of the univariate and baseline/final multivariable logistic regression analyses for the perioperative risk factors of pressure injury. All previously known and clinically estimated risk factor candidates were explored using univariate analyses. Through univariate analysis, the following seven independent variables with a cut-off value of P < 0.1 were included in the multivariate analysis: preoperative plasma concentration of protein, surgery time, total infused volume of fluids, total administered volume of blood product, total volume of intraoperative bleeding, total administered amounts of vasopressor, and comorbidity of malignancy. The final reduced model indicated that a preoperative plasma concentration of protein was associated with a 0.5-fold lower pressure injury (adjusted odds ratio [AOR]: 0.502; 95% confidence interval, 0.267-0.953; P = 0.034) (Table 3).
The Hosmer-Lemeshow goodness-of-fit test showed that the fitted values of the multivariable logistic regression model (final reduced model) showed chi-squared = 9.3867, df = 8, and P value = 0.3107 and, therefore, was a valid model. All variables in our final reduced regression model had a variance inflation factor value below 10, which showed no collinearity. In the ROC analysis, the final reduced model showed an area under the curve of 0.711 in pressure injury, with an optimal cut-off value of 5.17, and 68.6% sensitivity and 65.2% specificity.
DISCUSSION
The incidence of pressure injury in this study was approximately 5.9%, with stage-1 and stage-2 injuries accounting for 18% and 82% of all injuries, respectively (Table 1). The difference in incidence among studies may be based on the patients’ characteristics, type of surgery, surgical position, injury stage, and follow-up time after surgery. Hwang et al. [9] reported a pressure injury incidence of 4.3% in all surgical positions and 30% in the prone position. Choi et al. [3] reported a higher incidence of 23.8% in all surgical positions and 63.9% in the prone position. In the prone position, decreased venous return and inferior vena cava compression were associated with decreased tissue perfusion [12]. Weight-bearing areas are at risk of pressure injury occurrence. We used the Jackson Spinal & Imaging Table (JST 2000, Mizuhosi OSI, USA). The most injured regions included the face (28.6%), inguinal region (28.6%), and chest (24.5%), whereas Luo et al. [13] reported that the most injured region was the ischium (85.8%). However, the types of operating tables and weight-supporting areas used in the two studies may be different. Since the detailed design of the weight-supporting area is different for each frame of the operation table, the injury site also depends on the frame. In addition, the type of face pillows and the prophylactic dressings used can also affect these results [14,15].
A stage-1 injury could be a potential risk factor for a more severe form of pressure injury [5,6]. The criteria for stage-1 injuries, such as redness and erythema, may be subjective and could be missed in an physical examination for pressure injury. Non-blanching erythema must be distinguished from blanching erythema since it may lead to pressure ulcer development [5]. Another reason for the high incidences reported by Hwang et al. [9] and Choi et al. [3] was that they included injuries that occurred until the 24th hour. The pressure injuries could have been caused by the excessive friction or shearing forces applied during the transfer of patients from the surgical table to a stretcher or hospital bed.
Proteins are generally known as indicators of a patient’s nutritional status and play an important role in healing damaged skin by affecting collagen synthesis, activation of the immune system, and fibroblast proliferation [16]. Among all plasma proteins, albumin has the largest proportion. Previous studies often used albumin levels instead of proteins to demonstrate a correlation between pressure injury and serum protein levels [2,5]. However, the results are unclear [2,3,5,14,17]. Albumin has a short half-life; thus, it may not reflect the patient’s nutritional status at the time of surgery. Various proteins, such as α-, β-, and γ-globulin and fibrinogen exist in plasma, and the colloid oncotic pressure (COP) is determined by the total amount of proteins present in plasma. When a specific protein in the plasma decreases, COP may also decrease, resulting in interstitial edema, which is a major cause of pressure injury [10].
Choi et al. [3] reported that the risk increased 4.5 times in surgeries with a duration greater than 4 h, and Hicks [18] reported twice the incidence in surgeries that lasted longer than 4 h. In this study, the average surgery time was 3.5 h, which may have contributed to the low association between this factor and pressure injury occurrence. Large intraoperative bleeding can cause both hypotension and low hemoglobin levels, which may decrease tissue perfusion and oxygenation. Consequently, it may increase the risk of pressure injury. In this study as well as previous studies, the intraoperative total amount of fluid and blood products, the total volume of bleeding, and the total amount of vasopressor, showed a positive correlation with pressure injury occurrence (Table 3) [3,11,19]. Nutritional deficits, such as cachexia and low activity levels due to fatigue, are usually accompanied by malignancy [20]. These factors are highly related to the previously known risk factors of pressure ulcers, and Ranzani et al. showed its correlation [21]. However, although some patients have completed chemotherapy and radiation therapy and are in a complete remission state, it is still difficult to explain why pressure injury occurred in these patients.
Pressure injury can cause prolonged hospitalization. Han et al. [22] reported that pressure injuries influenced mortality (OR 2.18) and increased the risk of increased hospital stay (OR 5.55), along with increased risk of readmission (OR 1.30) and emergency department visits after discharge (OR 1.70). Analysis of the association between pressure injury and medical costs requires further research using substantial data.
There are a few limitations to this study. Since this is a study performed with patients from a single institution with a relatively small number of patients, differences in surgery time, operating tables, protective equipment, and comorbidities of patient groups may have affected the results. There may have been other potential confounders. The area under the curve value of 0.711 may indicate that the model used was not optimal. Therefore, our model may not fully explain the risk factors for intraoperative pressure injury, and it is expected that there are more potential risk factors that we were unable to identify.
In conclusion, the incidence of pressure injury was considerable and mainly lower-stage injuries occurred. Pressure injury mainly occurred in the region directly receiving weight load during spinal surgery. In the cases of pressure injuries occurred within a relatively short period of time as like as intraoperative period, preoperative risk factors such as plsma protein level rather than intraoperative factors may be more closely related to the pressure injury. Although further follow-up studies are needed to prove this assumption, it is believed that the patient's nutritional status and fluid status related to colloid oncotic pressure have a substantial influence on the incidence of pressure injury [10,16]. Therefore, proper correction of plasma protein level before surgery is very important in preventing pressure injuries.