Changes in the allocation policy for deceased donor livers in Korea: perspectives from anesthesiologists
Article information

Abstract
Background
The allocation policy for deceased donor livers in Korea was changed in June 2016 from Child-Turcotte-Pugh (CTP) scoring system-based to Model for End-stage Liver Disease (MELD) scoring system-based. Thus, it is necessary to review the effect of allocation policy changes on anesthetic management.
Methods
Medical records of deceased donor liver transplantation (DDLT) from December 2014 to May 2017 were reviewed. We compared the perioperative parameters before and after the change in allocation policy.
Results
Thirty-seven patients underwent DDLT from December 2014 to May 2016 (CTP group), and 42 patients underwent DDLT from June 2016 to May 2017 (MELD group). The MELD score was significantly higher in the MELD group than in the CTP group (36.5 ± 4.6 vs. 26.5 ± 9.4, P < 0.001). The incidence of hepatorenal syndrome was higher in the MELD group than in the CTP group (26 vs. 7, P < 0.001). Packed red blood cell transfusion occurred more frequently in the MELD group than in the CTP group (5.0 ± 3.6 units vs. 3.4 ± 2.2 units, P = 0.025). However, intraoperative bleeding, vasopressor support, and postoperative outcomes were not different between the two groups.
Conclusions
Even though the patient’s objective condition deteriorated, perioperative parameters did not change significantly.
INTRODUCTION
Since establishment of the Korean Network for Organ Sharing (KONOS) in 2000, allocation of deceased donor livers had been performed according to patient status using Child-Turcotte-Pugh (CTP) score [1]. This system is based on that of the United Network for Organ Sharing (UNOS). Since 2002, UNOS has maintained an allocation policy that relies on Model for End-stage Liver Disease (MELD) score, and this practice has been adopted in many countries to distribute deceased donor livers [2,3]. After several years of research and simulation, the allocation policy based on MELD score was implemented in Korea in June 2016 [3].
Although debates remain on the association between MELD score and surgical outcomes, the MELD score-based allocation policy has led to a reduction in the number of new registrations on waiting lists, lower mortality, shorter listing time, and an increase in the number of liver transplantation (LT) without altering the overall graft and patient survival rates after LT. As prioritization of recipients has switched from time on the waiting list to the principle of “sickest first”, the medical severity of recipient status has increased [4,5]. Obviously, MELD score-based allocation brings sicker patients to the operating room, and anesthetic management of these patients might be more challenging. Therefore, it is necessary to review the effect of the allocation policy change on anesthetic management of transplant recipients.
The aim of the present study was to analyze and report changes in patient status and anesthetic management before and after implementation of the MELD scoring system at a single institution.
MATERIALS AND METHODS
After obtaining approval from the Institutional Review Board (no. 2020-04-155), we retrospectively investigated adult patients who underwent deceased donor liver transplantation (DDLT) from September 2014 to May 2017. Included patients were divided into two groups according to allocation policy. Multiple organ transplantation, pediatric patients, and re-transplant cases were excluded. Thirty-seven patients underwent transplantation before the new allocation policy was adopted (CTP group) while 42 patients had surgery after the new allocation policy was implemented (MELD group).
According to the overall surgical policy at our institution, anastomosis of the liver graft was performed using a piggyback technique without a veno-venous bypass, and intraoperative continuous renal replacement therapy (CRRT) was not administered. A cell salvage device was used routinely during LT. Transfusion guidelines for the hospital were hemoglobin 8 g/dl for packed red blood cells (RBCs), hemoglobin 9 g/dl for cell salvage blood, prothrombin time (PT) expressed as an international normalized ratio (INR) 3 for fresh frozen plasma (FFP), platelet count 30 K/μl for platelet concentrate, and fibrinogen 80 mg/dl for cryoprecipitate.
Patient age, sex, MELD and CTP scores at the time of allocation, prevalence of hepatorenal syndrome (HRS), preoperative use of CRRT, and primary liver disease were investigated. For intraoperative parameters, incidence of potassium level > 4.5 mEq/L before reperfusion and base excess < –10 mEq/L during surgery, blood loss, transfusion amount, operation time, and maximal vasoactive-inotropic score (VISmax) were analyzed. Lengths of pre- and postoperative stays in intensive care units (ICU), postoperative mechanical ventilation, and total hospital stay, along with the one-year patient and graft survival rates were analyzed. And the same parameters were analyzed by subdividing each group into high (> 30) and low MELD scores (≤30).
The amount of intraoperative blood loss was calculated using the concept of red cell mass (RCM). Lost RCM (ml) = estimated blood volume (ml) × (preoperative hematocrit in % – postoperative hematocrit in %) + (transfused packed RBCs in units × 213 × 70%) + (transfused cell salvage blood in ml × 55%) [6]. The VISmax was calculated using the following equation: VISmax = dopamine dose (μg/kg/min) + dobutamine dose (μg/kg/min) + 100 × epinephrine (μg/kg/min) + 10 × milrinone dose (μg/kg/min) + 10,000 × vasopressin dose (U/kg/min) + 100 × norepinephrine dose (μg/kg/min) [7].
Continuous variables showing normality were analyzed using Student t-test and are expressed as mean ± standard deviation. Continuous variables that did not show normality were analyzed using Mann–Whitney U test and are expressed as median (1Q, 3Q ). Categorical variables were presented as number and frequency and were compared using chi-square test or Fisher’s exact test. For all analyses, a P value < 0.05 was considered statistically significant. Statistical analyses were performed using IBM SPSS Statistics software, version 25.0 (IBM Co., Armonk, NY, USA).
RESULTS
Table 1 summarizes the demographic characteristics of the patients. Although there was no difference in CTP score between the two groups, the MELD score was significantly higher in the MELD group than in the CTP group (36.5 ± 4.6 vs. 26.5 ± 9.4, P < 0.001). The incidence of HRS also was higher in the MELD group than in the CTP group (26 vs. 7, P < 0.001).
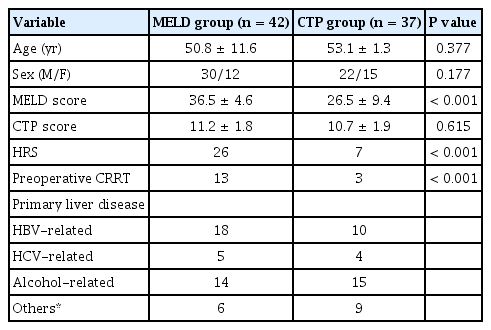
Demographic Characteristics of the Patients
Intraoperative profiles are summarized in Table 2. Although preoperative hemoglobin concentration was not different between the two groups, the amount of packed RBC transfusion was higher in the MELD group than in the CTP group (5.0 ± 3.6 units vs. 3.4 ± 2.2 units, P = 0.025). Only one case in the CTP group received transfusion-free transplantation. The amount of blood loss, operation time, and VISmax were not significantly different between the two groups.
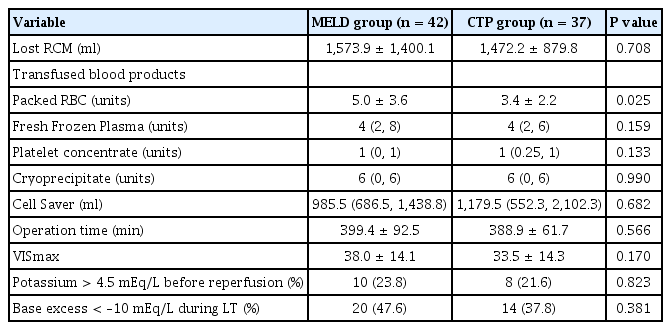
Intraoperative Profiles of the Patients
Pre- and postoperative ICU stay, total hospital stay, and patient and graft survival rates are presented in Table 3; no variables showed significant difference between the two groups.

Postoperative Profiles of the Patients
In subgroup analysis, MELD score was significantly higher in the MELD group with score both ≤ 30 (median value: 29 vs. 19.9 ± 5.7, P = 0.005) and > 31 (median value: 40 vs. 36 ± 2.3, P = 0.048). Patients with a MELD score less than 30 numbered 5 patients in the MELD group while 22 in the CTP group (Fig. 1). Length of postoperative ICU stay was significantly shorter in the MELD group with low MELD score compared to the CTP group with low MELD score (median: 4 days vs. 5.5 days, P = 0.023). All other variables showed no significant difference (Tables 4, 5).
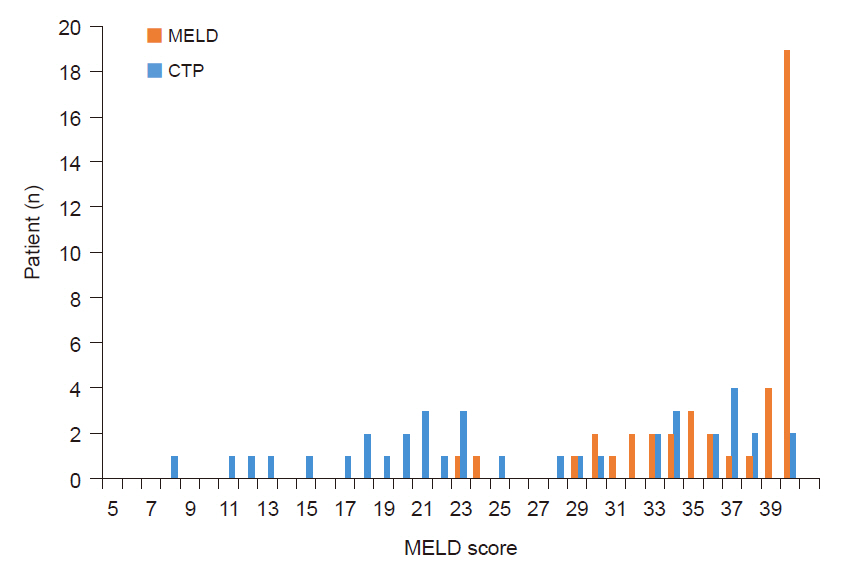
Numbers of patients in the MELD group and the CTP group based on MELD score. MELD: Model for End-stage Liver Disease, CTP: Child-Turcotte-Pugh.
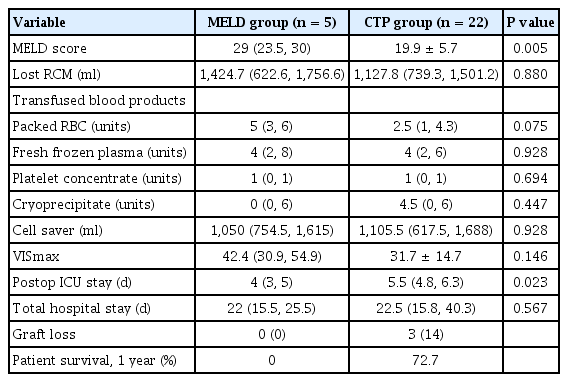
Perioperative Profiles of the Patients with Low MELD Score (≤ 30)
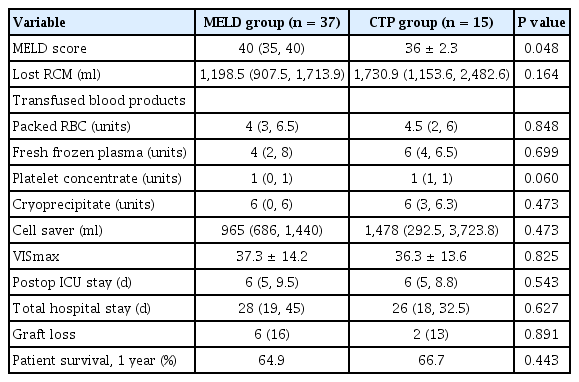
Perioperative Profiles of the Patients with High MELD Score (> 30)
DISCUSSION
The MELD score is calculated by three objective laboratory test results, while the CTP score includes subjective variables such as ascites and hepatic encephalopathy. As CTP score has limitations in reflecting medical severity of patient condition and the subjective judgment of medical staff may play a role, MELD score may be superior to CTP score [4]. Indeed, there was a significant difference in MELD score between the two groups in the present study, while CTP score showed little difference.
The numbers of patients with HRS and those undergoing CRRT preoperatively were significantly higher in the MELD group. Preoperative kidney dysfunction may complicate intraoperative management of these patients due to intravascular fluid accumulation and shifts in acid-base status and electrolytes [8]. Meanwhile, the incidence of intraoperative K+ > 4.5 mEq/L before reperfusion or severe metabolic acidosis (base excess < –10 mEq/L throughout LT) showed no significant difference between the two groups. This finding can be explained as follows. Unlike acute renal failure, pulmonary edema, metabolic acidosis, or hyperkalemia is not common in HRS, except in cases of excessive fluid therapy [9,10]. Any CRRT performed immediately before LT would partially adjust the acid-base balance and electrolytes. Also, in line with another report from our institution, serum potassium level and metabolic acidosis can be well controlled medically in recipients managed with preoperative CRRT [11]. However, the presence of HRS prior to transplantation is a strong predictor of mortality after LT [12]. The prognosis for patients with cirrhosis and renal failure is poor, and HRS is associated with the worst prognosis [9]. Further study of the long-term outcomes after the allocation policy change is required.
Prioritizing the sickest patients raises concerns, such as increased risk of intraoperative bleeding and increased frequency of transfusion. However, except for packed RBC transfusion, this study found no significant difference in patients following the allocation policy change. This result is similar to those of another study in which MELD score did not predict blood loss or blood product requirement during LT [13]. In a study that evaluated the effect of the MELD score-based allocation system in LT, increased blood loss and transfusion rates were noted [14]. However, consistent with our results, Varotti et al. [15] suggested that MELD score is an independent variable associated with increased perioperative packed RBC transfusion. In a study by Frasco et al. [16], MELD score and preoperative fibrinogen concentration were independent predictors of transfusion exposure. They detected significant differences in severity of disease at the time of transplantation (as indicated by a higher MELD score), degree of impairment of coagulation function, and need for transfusion of RBCs and component therapy by comparing living donor LT and cadaveric donor LT [16]. This outcome may explain our findings of increased packed RBC transfusion in the MELD group. The causes of bleeding during LT can be multifactorial, and there is a limit to predicting the amount of bleeding or transfusion using only MELD score. Despite these limitations and the relatively small sample size of this study, a larger amount of packed RBC transfusion in the MELD group may be a notable finding.
Preoperative INR in the MELD group was significantly higher than that in the CTP group (3.45 ± 2.87 vs. 2.30 ± 0.83, P = 0.020). This result was not unexpected because MELD score is calculated based on total bilirubin, INR, and creatinine. However, surprisingly, there was no significant difference in FFP transfusion rate between the two groups, which may be partly explained by rebalanced hemostasis. Multiple studies have shown that patients with cirrhosis have deficiencies in both the pro-coagulant and anticoagulant pathways, leading to a “rebalanced” coagulation system [17–19]. The extent of coagulopathy as measured by PT or INR does not appear predictive of bleeding complications, and the observed derangements in hemostatic variables might not translate to a diffuse bleeding risk during LT [17,20]. However, prediction, prevention, and monitoring of bleeding in patients with liver disease are complicated as a result of their extensive baseline changes and a more precarious hemostatic system in these patients [17,18]. Although some studies have reported no differences in bleeding or blood transfusion rates before or after using this coagulation testing [21], application of a viscoelastic coagulation test for liver transplantation may be recommended to reduce the incidence of bleeding and blood transfusion. This test has the advantage of reflecting the overall process of coagulation, and it is more sensitive and accurate at diagnosing coagulopathy than conventional coagulation test performed during the surgery [22].
The VIS is a scale showing the amounts of vasoactive and inotropic support [7]. We analyzed VISmax to identify any change in vasopressor support during LT and found no statistically significant difference. However, Xia et al. [23] reported that patients with a high (> 30) MELD score required more vasopressors both before and during LT, although they only indicated whether a vasopressor was administered and did not specify the amount. VISmax was higher in the high-MELD score patients in the CTP group than in the low-MELD score patients, although the difference was not statistically significant (31.7 ± 14.7 vs. 36.3 ± 13.6, P = 0.071). Only five patients in MELD group had a low MELD score, and the VISmax analysis in the MELD group was limited. Further exploration with a larger sample size is necessary.
Giving priority to the sickest patient has the potential to create other concerns such as longer ICU stay. Oberkofler et al. [12] reported that MELD score greater than 23 was an independent risk factor for morbidity represented by ICU stay longer than 10 days. Oberkofler et al. [12] also found that transfusion of more than seven units of packed RBCs was an independent risk factor for mortality and prolonged ICU stay. Otherwise, there was no significant difference in duration of ICU stay in the present study. A similar group of patients reported by our institution showed no significant difference in six-month survival rate or in-hospital stay, but complication and readmission rates within the first three months were higher in the MELD group [24]. The one-year survival rate analyzed in this study did not differ significantly between the two groups. This finding is consistent with the results of other studies that overall patient survival after change to MELD scoring was not worse than that based on the pre-MELD criteria [9,25,26].
This study had certain limitations. It utilized a retrospective study design based on single-center data and a small sample size. Temporal changes in clinical practice would have influenced the results beyond a change in allocation system. In addition, demographics and underlying physical status of the donor and quality of the graft, which may influence the need for transfusions and vasopressors, were not addressed in the study. Also, the data included only DDLT, so the results may differ in LDLT recipients.
Contrary to our expectations, although the patient’s objective condition worsened, perioperative parameters did not change significantly. This outcome may be attributed to advances in perioperative monitoring skills, improved proficiency of surgeons, or more sophisticated ICU management. Our finding can also be explained by the shorter postoperative ICU stay of the MELD group than that of the CTP group in participants with low MELD score. Despite these limitations, this topic is important, especially from the anesthesiologist’s perspective. The parameters were compared immediately before and after conversion to the MELD score-based allocation system, and also were compared by dividing the patients into groups according to MELD score. In addition to the results shown by the parameters, it was clear that objective patient condition had deteriorated, and that it is difficult to predict the patient progress during LT. As a result, more detailed perioperative care is required in the MELD era.
Notes
CONFLICTS OF INTEREST
No potential conflict of interest relevant to this article was reported.
AUTHOR CONTRIBUTIONS
Conceptualization: Gaab Soo Kim. Data acquisition: Seung Yeon Yoo, Gaab Soo Kim. Data analysis: Seung Yeon Yoo. Writing-original draft: Seung Yeon Yoo. Writing-review & editing: Seung Yeon Yoo, Gaab Soo Kim.