Improvement of compliance to the Portland intensive insulin therapy during liver transplantation after introducing an application software: a retrospective single center cohort study
Article information

Abstract
Background
The Portland intensive insulin therapy effectively controls acute hyperglycemic change after graft reperfusion during liver transplantation. However, the time-consuming sophistication acts as a barrier leading to misinterpretation and decreasing compliance to the protocol; thus, we newly introduced an application software “Insulin protocol calculator” which automatically calculates therapeutic bolus/continuous insulin doses based on the Portland protocol.
Methods
Of 144 patients who underwent liver transplantation, 74 patients were treated before the introduction of "Insulin protocol calculator" by using a paper manual, and 70 patients were treated by using the application. Compliance was defined as the proportion of patients treated with exact bolus/continuous insulin dose according to the Portland protocol.
Results
Compliance was significantly greater in app group than in paper group regarding bolus dose (94.5% and 86.9%, P < 0.001), continuous dose (88.9% and 77.3%, P = 0.001), and both doses (86.6% and 73.8%, P < 0.001). Blood glucose concentration was significantly lower in app group at 3 h (125 ± 17 mg/dl vs. 136 ± 19 mg/dl, P = 0.014) and 4 h (135 ± 22 mg/dl vs. 115 ± 15 mg/dl, P = 0.029) after graft reperfusion. Acute hyperglycemic change during 30 min was more prominent in app group while hyperglycemia incidence was 71.4% vs. 54.1% (P = 0.031). However, hyperglycemia risk was comparable at 2 h (31.4% vs. 31.1%, P = 0.964), and even insignificantly lower in app group at 3 h (7.1% vs. 19.5%, P = 0.184).
Conclusions
Compliance to the Portland protocol was significantly improved after introducing the application software; post-reperfusion hyperglycemia was better controlled. “Insulin protocol calculator” is cost-effective and time-saving with potential clinical benefits.
INTRODUCTION
Liver transplantation is attended with various metabolic disturbances. A rapid increase in blood glucose concentration (BGC) after graft reperfusion is one of them [1,2]. Intraoperative hyperglycemia is associated with decreased immunity, increased ischemia-reperfusion injury, infectious complications, and mortality [3–10]. Accordingly, liver transplant anesthesiologists give efforts to maintain glycemic homeostasis after graft reperfusion [9].
We introduced the Portland protocol (Supplementary Table 1) in January 2015 to better control the post-reperfusion hyperglycemic change in the patients whose insulin sensitivity was impaired due to underlying chronic liver disease, surgical stress, vasoactive drugs, and steroid immunosuppression [9,10]. The Portland protocol was initially designed for patients treated in surgical cardiac intensive care unit and validated in various surgical settings [11,12]. The success is attributable to a dynamic algorithm modifying insulin doses by accounting for patient insulin sensitivity which is evaluated based on the rate of BGC change. That is, calculated insulin doses differ by the rate of BGC change even if the current BGC is same [13]. Our research team recently demonstrated that the dynamic algorithm was also very effective to control the acute hyperglycemic change after graft reperfusion of liver transplantation [9].
However, the protocol designed for intensive care unit environment is not intuitive and the algorism is somewhat complicated to use during the post-reperfusion phase when the anesthesiologists are busy handling various acute hemodynamic/metabolic changes particularly when patients' course is unstable. We considered that the time-consuming sophistication acted as a barrier to decreasing compliance with the protocol [13]. Accordingly, in November 2018, we newly introduced an application software for smart devices named "Insulin protocol calculator" distributed by Apple incorporation to automatically calculate the therapeutic insulin doses (Supplementary Fig. 1). We hypothesized that the use of the application software decreases misinterpretation and increases compliance to the Portland protocol. Thus, we aimed to compare compliance to the Portland protocol before vs. after the use of “Insulin protocol calculator”.
MATERIALS AND METHODS
Subjects and data collection
We reviewed the medical records of 144 patients who underwent liver transplantation between January 2017 and October 2020 and were treated with the same Portland protocol to manage acute hyperglycemic response after graft reperfusion: 74 patients were treated before the introduction of “Insulin protocol calculator” in November 2018 by using a paper manual (paper group), and 70 patients were treated by using the application software “Insulin protocol calculator” (app group). All data were collected from the computerized medical records or liver transplant database (prospectively collected), and were anonymized and de-identified prior to analysis. The Institutional Review Board of Korea cancer center hospital approved this retrospective study (no. KCC 2021-12-004) and waived the requirement for written informed consent. All procedures were performed in accordance with the relevant guidelines and regulations.
Perioperative glycemic management
The recipients fasted starting the evening before surgery, and 5% dextrose solution was infused at a rate of 80 ml/h during the fasting period. Preoperative oral carbohydrate supplements were not provided. During the surgery, arterial BGCs were measured in combination with other arterial blood-derived parameters using a blood gas/chemistry analysis device (RAPIDLAB1265, Siemens Healthcare Diagnostics Inc., Germany) on an hourly basis, as well as at the following additional time points: start of the anhepatic phase and 5 min/30 min after graft reperfusion, as described previously [14]. The blood gas/chemistry analysis device was near each patient and clinicians were able to reach the device within 1 min after blood sampling. In general, insulin therapy was not indicated for controlling BGC before graft reperfusion because BGC decreases during the anhepatic phase due to the lack of hepatic glucose production [15]. In contrast, hyperkalemia was corrected using the conventional large-bolus insulin method (10 units of regular insulin) if the blood potassium concentration (BPC) was > 4.5 mEq/L [16]. After graft reperfusion, the Portland protocol was applied until intensive care unit arrival: the doses for bolus injection and continuous infusion were automatically calculated after inputting the previous BGC, current BGC, last insulin infusion rate, the presence of diabetes, and target BGC (Supplementary Fig. 1) [17].
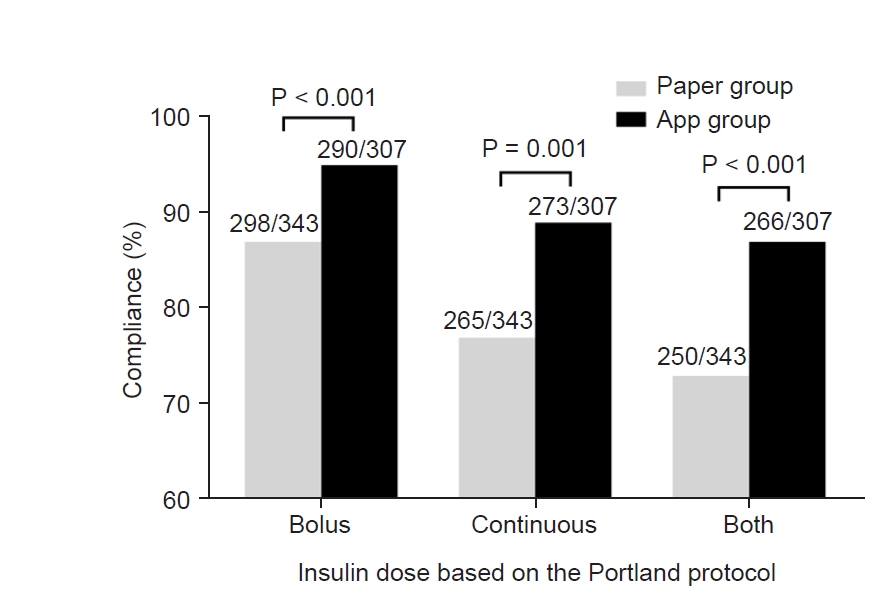
Compliance to the Portland protocol when using a paper manual the application software "Insulin protocol calculator".
Anesthetic management
Anesthesia and hemodynamic monitoring were performed based on the standardized institutional protocol, as described previously [14,18]. In short, mechanical ventilation was delivered at a tidal volume of 8 ml per ideal body weight (kg) using a mixture of medical air and oxygen with positive end-expiratory pressure being set at 6 mmHg. The respiratory rate was adjusted as needed to maintain normocapnia. Vasoactive drugs were used to maintain mean arterial pressure > 70 mmHg. Metabolic acidosis was corrected with sodium bicarbonate when the base deficit was > 10 mEq/L. Body core temperature was maintained using a circulating water mattress, forced-air blanket, airway warming circuit, or fluid warmers. Transfusion of allogeneic blood products was strictly controlled based on a restrictive and prophylactic policy, with each blood component being transfused separately according to its respective indication [14,19]. Blood salvage was routinely used for intraoperative autotransfusion irrespective of the presence of a hepatic tumor [20,21].
Perioperative surgical procedures
Acceptance criteria for liver donation were age ≤ 65 years, body mass index < 35 kg/m2, macrosteatosis ≤ 30%, and residual liver volume ≥ 30%. Individuals with any type of hepatitis or fibrosis were excluded from donation. Graft implantation was primarily performed using the piggyback technique. After the portal vein anastomosis was completed, the graft was re-perfused by consecutively unclamping the hepatic vein and portal vein. The hepatic artery was subsequently anastomosed, followed by biliary anastomosis. Immunosuppression was performed based on a quadruple regimen consisting of methylprednisolone, basiliximab, mycophenolate mofetil, and tacrolimus as described previously [20,22]. In particular, recipients received methylprednisolone 500 mg intravenously before graft reperfusion for the induction of immunosuppression.
Variables and statistical analysis
The primary outcome was compliance to the Portland protocol. Compliance was defined as the proportion of patients who were treated with the exact bolus or continuous insulin dose based on the Portland protocol. Secondary outcomes were BGC and BPC. For dichotomous analysis, hyperglycemia was defined when BGC was > 150 mg/dl based on previous studies of liver transplant recipients [7,23]. Coefficient of variation, which is defined as the ratio of the standard deviation to the mean, of BGCs within a subject was calculated to analyze glycemic variability because BGC fluctuation is known to be clinically important in addition to BGC itself [24–26]. Continuous variables are expressed as mean ± standard deviation or median (1Q, 3Q) and were analyzed by t-test or the Mann–Whitney test, as appropriate. Categorical variables are expressed as frequency (%) and were analyzed by chi-square test. P < 0.05 was considered statistically significant. Analyses were performed using SPSS version 23.0 (IBM, USA).
RESULTS
Compliance to the Portland protocol
Preoperative characteristics of patients in paper group and those in app group are shown in Table 1. The Portland protocol was applied 343 times in paper group, and 307 times in app group. As shown in Fig. 1, in terms of bolus insulin dose, the compliance was significantly greater in app group than in paper group (290/307 [94.5%] and 298/343 [86.9%], P < 0.001). In terms of continuous insulin dose, compliance was significantly greater in app group (273/307 [88.9%] and 265/343 [77.3%], P = 0.001). The proportion of patients who were treated with exact bolus and continuous insulin doses was significantly greater in app group (266/307 [86.6%] and 250/343 [73.8%], P < 0.001).

Patient Baseline Characteristics
Blood glucose concentration after the start of the Portland protocol
BGC just before the graft reperfusion was not significantly different between the two groups (116 ± 32 mg/dl in paper group, and 114 ± 32 mg/dl in app group, P = 0.734). BGC at the start of the Portland protocol (5 min after graft reperfusion) was not significantly different between the two groups (137 ± 30 mg/dl and 134 ± 28 mg/dl, P = 0.712). As shown in Fig. 2, BGC at 30 min, 1 h, 2 h, 3 h, and 4 h after graft reperfusion were 153 ± 25 mg/dl, 149 ± 22 mg/dl, 142 ± 21 mg/dl, 136 ± 19 mg/dl, and 135 ± 22 mg/dl, respectively, in paper group, and 155 ± 26 mg/dl, 153 ± 23 mg/dl, 140 ± 22 mg/dl, 125 ± 17 mg/dl, and 115 ± 15 mg/dl, respectively, in app group. BGC was significantly lower in app group than paper group at 3 h (P = 0.014) and 4 h (P = 0.029). The maximum BGC was 161 ± 20 mg/dl in paper group, and 162 ± 21 mg/dl in app group (P = 0.856). The minimum BGC was 130 ± 19 mg/dl in paper group, and 130 ± 23 mg/dl in app group (P = 0.986). The coefficient of variation was 0.10 ± 0.06 in paper group, and 0.11 ± 0.06 in app group (P = 0.593). As shown in Fig. 3, post-reperfusion hyperglycemic response was more prominent in app group than in paper group. Although hyperglycemia risk was significantly greater in app group at 30 min (71.4% vs. 54.1%) and 1 h (57.1% vs. 39.2%) after graft reperfusion (P = 0.031 for each), it became comparable at 2 h (31.1% vs. 31.4%, P = 0.964). Even hyperglycemia risk was insignificantly lower in app group at 3 h (7.1% vs. 19.5%, P = 0.184), suggesting the superiority of the app-based intervention to the paper-based intervention.
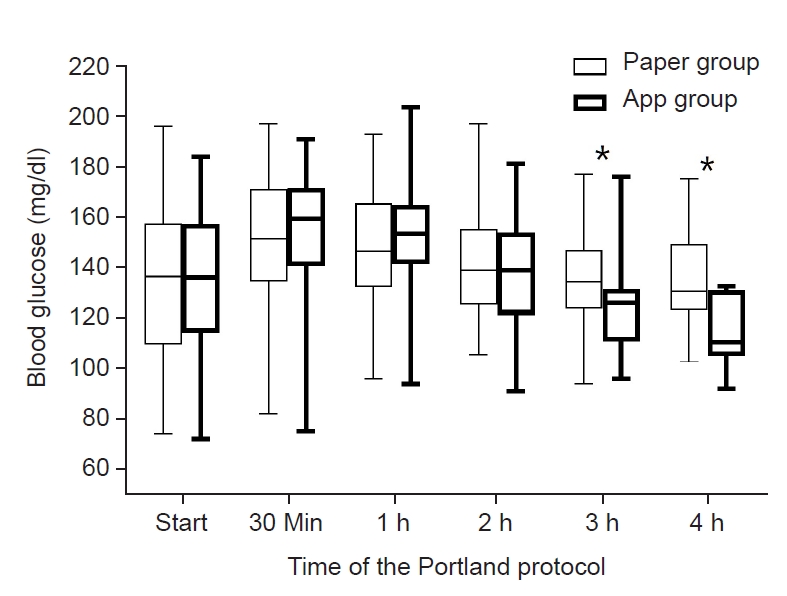
Blood glucose concentrations after graft reperfusion when using the Portland protocol based on a paper manual or the application software "Insulin protocol calculator". *Means P < 0.05.
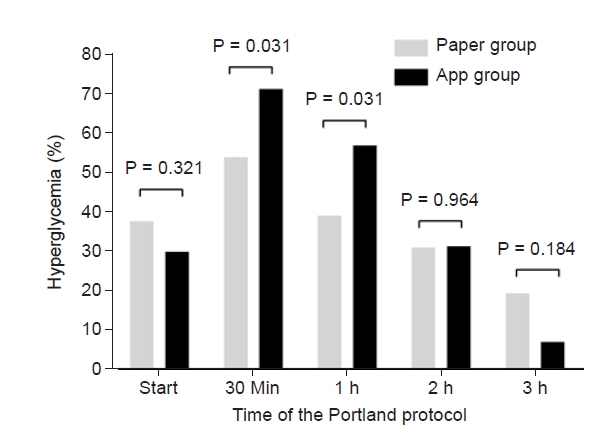
Hyperglycemia incidence after graft reperfusion when using the Portland protocol based on a paper manual or the application software "Insulin protocol calculator".
Blood potassium concentration after the start of the Portland protocol
BPC just before graft reperfusion was not significantly different between the two groups (3.84 ± 0.38 mEq/L in paper group and 3.86 ± 0.41 mEq/L in app group, P = 0.800). BPC at the start of the Portland protocol was not significantly different between the two groups (3.73 ± 0.44 mEq/L and 3.74 ± 0.43 mEq/L, P = 0.928). As shown in Fig. 4, BPC at 30 min, 1 h, 2 h, 3 h, and 4 h after graft reperfusion were 3.71 ± 0.43 mEq/L, 3.78 ± 0.45 mEq/L, 3.64 ± 0.50 mEq/L, 3.68 ± 0.59 mEq/L, and 3.74 ± 0.64 mEq/L, respectively, in paper group, and 3.74 ± 0.44 mEq/L, 3.81 ± 0.47 mEq/L, 3.63 ± 0.47 mEq/L, 3.72 ± 0.44 mEq/L, and 3.51 ± 0.21 mEq/L, respectively, in app group. BPC was not significantly different between the two groups in all measured time points (P > 0.05). The maximum BPC was 3.96 ± 0.51 mEq/L in paper group, and 3.99 ± 0.51 mEq/L in app group (P = 0.754). The minimum BPC was 3.47 ± 0.42 mEq/L in paper group, and 3.49 ± 0.39 mEq/L in app group (P = 0.826).

Blood potassium concentration after graft reperfusion when using the Portland protocol based on a paper manual or the application software "Insulin protocol calculator". P > 0.05 in all time points.
DISCUSSION
Continuing from our previous work, demonstrating the superiority of the Portland protocol compared to the conventional bolus insulin therapy to control hyperglycemic change after liver graft reperfusion, this study aimed to test a strategy to increase the compliance to the protocol. Since it takes some time to read, translate, and interpret the sophisticated Portland protocol, liver transplant anesthesiologists, who are busy after graft reperfusion, could have difficulty in calculating the exact bolus/continuous insulin doses. By removing the step of reading, translating, and interpreting, we could decrease misinterpretation risk and increase the compliance to the delicate protocol. Consequently, acute hyperglycemic response during the intraoperative post-reperfusion phase was better controlled without the increase in the risk of hypoglycemia or hypokalemia. Contemporary medicine is becoming more computerized to minimize the error of medical actions [27], and the use of "Insulin protocol calculator" is in line with that.
The application software is intuitive and user-friendly; thus, physicians can use it following the short and simple in-device introduction (https://www.houseofficer.com/ezinsulin) without professional education or precaution. Inputting 5 items (the previous BGC, current BGC, last insulin infusion rate, the presence of diabetes, and target BGC) automatically calculates the required bolus/continuous insulin doses (Supplementary Fig. 1). Sparing time and efforts by using the application can allow anesthesiologists to spend more time to the other parts of anesthesia, and may help improve patients’ clinical courses. Moreover, the application is open to public and can be easily downloaded in smart devices, being cost-effective.
Post-reperfusion hyperglycemic response was better controlled with the “Insulin protocol calculator” by increasing the compliance to the Portland protocol and giving exact insulin doses. This is important because hyperglycemia even during a short period is known to affect clinical courses. First, acute transient hyperglycemia even during a short period disturbs the innate immune system by inhibiting neutrophil migration, phagocytosis, and complement function, and by stimulating inflammatory cytokines, and decreasing microvascular reactivity [3,4]. Deterioration of innate immune response can promote infection progress [6,7,9]. Second, previous research demonstrated that only a transient period of acute hyperglycemia is necessary to aggravate ischemia-reperfusion injury via oxidative stress and impaired tissue microcirculation [1,5]. A previous study of critically ill patients demonstrated that hepatocyte mitochondrial ultrastructure and function can be protected by preventing acute hyperglycemia with tight glycemic control [28]. Third, decreased hepatic ischemia-reperfusion injury could also benefit the bile duct [29]. Ischemia-reperfusion injury to the microvasculature of the bile duct arteriolar plexus causes biliary epithelial cell damage; consequently, inflammatory cells penetrate between epithelial cells and basement membranes, and result in biliary stricture [30]. Fourth, acute hyperglycemia-induced oxidative stress is systemic and can affect various tissues and organs in remote areas including the diaphragm [9]. Some studies of patients undergoing liver surgeries have also highlighted the necessity of developing better intraoperative glycemic managements, by reporting the difficulties in controlling BGC and negative clinical impacts of intraoperative hyperglycemia [6–9]. In a previous study comparing 60 liver transplant recipients with mean intraoperative BGC of < 150 mg/dl, and 124 recipients with mean intraoperative BGC of ≥ 150 mg/dl, higher intraoperative BGC was associated with post-transplant infections and mortality [7]. Another study demonstrated that mean BGC during the day of surgery > 150 mg/dl was associated with risk of post-transplant acute kidney injury [23].
Selection bias is the most significant barrier in retrospective analysis, and the success of the study mainly depends on how efficiently the heterogeneity between groups is controlled. As this study used the so-called before-and-after analysis, the use of the paper manual or the application software was not determined by clinical situations or at the discretion of liver transplant physicians. That is, there was no phase-out period of conventional method or implantation period of new method during which significant selection bias could occur, and special concern was required while "Insulin protocol calculator" was universally implicated for all liver transplant recipients at a time point by mutual agreement of liver transplant anesthesiologists in our hospital. Our study model presented additional advantages for the robustness of data. First, this study included a relatively homogenous liver transplant population. Only 26 patients were with the model for end-stage liver disease score > 30. Second, the amount of injected/infused insulin was routinely recorded in a dedicated glycemic control chart; thus, the data regarding insulin doses were highly reliable. As the glycemic chart was routinely applied in all liver transplant recipients, we could exclude the possibility of anesthesiologists not knowing the use of the Portland protocol after graft reperfusion. Instead, we could consider that misread of the long and complex paper manual or mismanagement of the application software was the reason of the decrease in compliance. Third, the study period was 4 years and there were not likely unmeasured or unmeasurable practice changes, which could significantly affect compliance to the Portland protocol or the degree of post-reperfusion glycemic change, during the relatively short time period.
This study had several limitations. First, since we used the retrospective study design, we could not exclude the possibility of bias from unobserved or unmeasurable variables. Second, this study focused on compliance to the Portland protocol and the potential clinical benefits from the improvement of compliance, and better controlled hyperglycemic response needs to be evaluated in further research.
During liver transplantation, compliance to the Portland protocol was significantly improved by using an application software “Insulin protocol calculator” which automatically calculats therapeutic bolus/continuous insulin doses, and post-reperfusion hyperglycemic response was better controlled compared to when using a paper manual. In addition, using “Insulin protocol calculator” can save time to interpret the manual and help busy anesthesiologists focus on other hemodynamic/metabolic issues following graft reperfusion. This might be more beneficial for decompensated patients with unstable hemodynamic/metabolic courses.
SUPPLEMENTARY MATERIALS
Supplementary data including a Portland protocol original manual and main screen of "Insulin protocol calculator" can be found online at https://doi.org/10.17085/apm.22136
The Portland Protocol Original Manual. Portland Protocol During the Re-perfusion Phase in Liver Transplantation (Version 2008.2; ICU Phase 3; Target Blood Glucose 80–120 mg/dl). ICU: Intensive Care Unit.
The main screen of "Insulin protocol calculator". An application software "Insulin protocol calculator" for smart devices distributed by Apple incorporation to automatically calculate the therapeutic bolus/continuous insulin doses.
Notes
FUNDING
None.
CONFLICTS OF INTEREST
No potential conflict of interest relevant to this article was reported.
DATA AVAILABILITY STATEMENT
The datasets generated during and/or analyzed during the current study are available from the corresponding author on reasonable request.
AUTHOR CONTRIBUTIONS
Conceptualization: Sangbin Han. Data curation: Young Woong Choi. Formal analysis: Young Woong Choi. Methodology: Sangbin Han. Project administration: Young Woong Choi, Justin S. Ko, Su Nam Lee, Mi Sook Gwak, Gaab Soo Kim. Visualization: Justin S. Ko, Su Nam Lee, Mi Sook Gwak, Gaab Soo Kim. Writing - original draft: Young Woong Choi. Writing - review & editing: Sangbin Han. Supervision: Sangbin Han.