Effect of neoadjuvant chemotherapy on effect-site concentration of propofol for sedation in patients with breast cancer
Article information

Abstract
Background
Some studies have demonstrated that chemotherapy drugs enhance sensitivity to anesthetics owing to its systemic toxicity, while others have demonstrated that chemotherapy drugs have no effect. This study aimed to determine whether neoadjuvant chemotherapy influences the effect-site concentration (Ce) of propofol for sedation in patients with breast cancer.
Methods
This study included patients aged 19–75 years who were scheduled to undergo breast cancer surgery under general anesthesia. Patients who received neoadjuvant chemotherapy were assigned to group C, whereas those who never received chemotherapy were assigned to group N. Propofol was administered through an effect-site target-controlled infusion, and the Modified Observer’s Assessment of Alertness/Sedation scale (MOAA/S) score and Bispectral Index (BIS) were recorded. When the plasma concentration and Ce were equal to the target Ce, and if the MOAA/S score did not change, the target Ce was increased by 0.2 μg/ml; otherwise, the Ce was maintained for 2 min and then increased. This process was repeated until the MOAA/S score became 0.
Results
No significant differences were observed in Ce values at each sedation level between both groups. Ce values for loss of consciousness (LOC) of groups C and N were 2.76 ± 0.29 and 2.67 ± 0.27 μg/ml (P = 0.285), respectively. However, the BIS value at LOC of group C (63.87 ± 7.04) was lower than that (68.44 ± 6.01) of group N (P = 0.018).
Conclusions
Neoadjuvant chemotherapy for breast cancer has no effect on the Ce of propofol for sedation.
INTRODUCTION
Neoadjuvant chemotherapy is a type of cancer treatment in which chemotherapeutic drugs are administered before surgical extraction. It is recommended for locally advanced breast cancer without distant metastasis (especially in human epidermal growth factor receptor 2 [HER2]-positive and triple-negative breast cancer). Neoadjuvant chemotherapy not only increases the rate of breast conserving surgery by reducing tumor size but also enables precision medicine (e.g., adjuvant capecitabine or trastuzumab emtansine [T-DM1] for early breast cancer with residual disease) [1-5]. However, it has risks and side effects such as hair loss, extreme fatigue, weight loss, loss of appetite, nausea and vomiting, oral sores, constipation or diarrhea, neuropathy, decreased cognitive function, increased risk of infection, infertility, osteoporosis, leukemia, and heart disease. The systemic toxicities of chemotherapy in the nervous, hepatorenal, and cardiopulmonary systems have important implications in general anesthesia [6,7]. In particular, the neurotoxicity of chemotherapy, which induces pathophysiologic changes in the central and peripheral nervous systems, can influence sensitivity to anesthetics and the depth of sedation [8-10]. Some studies have demonstrated that there is a difference in the requirement for anesthetics between patients who did and did not receive chemotherapy [11-14]. A study by Wu et al. [12] on patients with breast cancer showed that propofol demand was lower in the neoadjuvant chemotherapy group than in the non-chemotherapy group. In addition, He et al. [14] reported that in patients with breast cancer, the median effective effect-site concentration (Ce50) of intravenous anesthetics (i.e., propofol and etomidate) causing loss of consciousness (LOC) in the neoadjuvant chemotherapy group was lower than that in the non-chemotherapy group. However, Ki et al. [15] had contrasting results, reporting that in colorectal cancer patients, no difference was observed in the Ce values of propofol for loss of verbal contact (LVC) and LOC between those who did and did not receive chemotherapy. Therefore, studies must confirm whether chemotherapy affects the pharmacodynamics (PD) of propofol. We recruited only female patients with breast cancer because the Ce of propofol for LOC showed a significant sex-dependent difference in the study by Ki et al. [15].
This study aimed to examine the Ce of propofol for each sedation level in female patients who received neoadjuvant chemotherapy for the treatment of breast cancer and to determine whether there is a difference in the Ce of propofol for sedation between those who received neoadjuvant chemotherapy and those who did not. In addition, we explored a PD model that determines the amount of propofol required for an appreciable depth of sedation.
METHODS
Study design
This prospective observational study was approved by the Institutional Review Board of our hospital (BP IRB 2019-01-171). We explained the study methods to each patient the day before surgery and obtained written informed consent from them. Clinical research was conducted in accordance with the Declaration of Helsinki of 1975 (revised 2013). Patients aged between 19 and 75 years, with a body mass index between 18 and 29.9 kg/m2 and an American Society of Anesthesiologists physical status class between 1 and 3, who were scheduled to undergo breast cancer surgery under general anesthesia were enrolled in this study. Patients with a history of receiving chemotherapy for the treatment of diseases other than breast cancer, chronic alcoholism, difficulty in communicating, difficulty in maintaining the airway during anesthesia induction, and taking sedatives or neuropsychiatric drugs were excluded. Among the included patients, those who received neoadjuvant chemotherapy for breast cancer were assigned to group C and those who did not were assigned to group N. We conducted a pilot study with nine patients (three patients in group C and six in group N), which revealed that the mean Ce value of propofol for LOC was 2.57 ± 0.50 μg/ml in group C and 2.92 ± 0.13 μg/ml in group N. On the basis of the results of the pilot study, effect size was calculated using “Cohen’s d” formula, and a sample number of 40 was calculated (20 patients per group) using G*power (version 3.1.9.2, Franz Faul, University Kiel, Germany) with the following settings: t-test; mean—difference between two independent means (two groups); tails—two; effect size—1.2006; power—0.95; α—0.05; and allocation ratio—1:1. In total, we enrolled 50 patients (25 per group).
Vital signs (electrocardiogram, heart rate, noninvasive blood pressure, and pulse oximetry) and Bispectral Indextm (BIS, Covidien, USA) were monitored throughout the surgery. End-tidal CO2 was monitored and 100% oxygen (6–8 L/min) was supplied using a facial mask for airway management during the study period. For anesthesia induction, propofol (Fresofol MCT inj. 2%, Fresenius Kabi Korea, Korea) was administered as an effect-site target-controlled infusion (Effect-site TCI; Orchestra® Base Primea, Fresenius Kabi Company, France), using the Schnider model [16]. The initial target Ce was 1.5 μg/ml. One investigator, who was blinded to the study, assessed the depth of sedation using the Modified Observer’s Assessment of Alertness/Sedation (MOAA/S) scale which was evaluated every 30 s [17], and the BIS value at that time point was also recorded. When the plasma concentration (Cp) and Ce became equal to the target Ce and if the MOAA/S score remained unchanged, the target Ce was increased by 0.2 μg/ml. However, if the MOAA/S score decreased, the target Ce was not increased immediately but was maintained for 2 min and then increased. This process was repeated until the MOAA/S score became 0. An MOAA/S score of 2 or 3 was defined as LVC, and an MOAA/S score of 0 or 1 was defined as LOC.
Statistical analyses
Statistical analyses were performed using MedCalc (version 20.110, MedCalc Software Ltd., Belgium) and GraphPad Prism (version 9.4.0, GraphPad Software, USA). A t-test was performed to compare the mean values of two independent samples (group C vs. group N). Quantitative data are expressed as mean ± standard deviation or median ± 95% confidence interval. A P value of < 0.05 was considered statistically significant.
Population PD analysis
The relationship between the probability of response (MOAA/S score) and the Ce of propofol and the relationship between the Ce of propofol and the BIS (effect, E) were explored using PD modeling with a nonlinear mixed-effects modeling software (NONMEM, NONMEM® 7.5, ICON Development Solution, Ireland).
where P (MOAA/S ≤ n) is the probability of the sedation level being equal to or less than a given MOAA/S score (n), Ce50 (n) is the Ce of propofol with a 50% probability of the MOAA/S score (n), and γ (Hill coefficient) is the slope steepness of the Ce versus the response (MOAA/S score) curve.
where E0 is the BIS value at no effect, Emax is the BIS value at maximal effect, Ce50 is the Ce of propofol associated with a 50% response, and γ is the slope steepness of the Ce versus the response (BIS) curve. The covariates that were analyzed were age and history of neoadjuvant chemotherapy. NONMEM computed the minimum objective function value (MOFV), which is a statistical equivalent to the –2log likelihood of the model. An α level of 0.05, which corresponds to a reduction in the MOFV of 3.84 (chi-square distribution, degree of freedom = 1 and P < 0.05), was used to distinguish between the hierarchical models [18,19].
RESULTS
We analyzed the data of 49 patients, of whom 24 were in group C, with one dropout due to the low signal quality index (SQI) of BIS, and 25 were in group N. Patient characteristics are summarized in Table 1. The period between the last neoadjuvant chemotherapy session and the start of the study was an average of 25.89 ± 12.30 days (the longest period was 62 days, and the shortest period was 6 days). In our study, neoadjuvant chemotherapy regimens were determined according to the molecular type (gene-based) of breast cancer: 1) luminal type and triple-negative type—adriamycin + cyclophosphamide or docetaxel + cyclophosphamide; 2) HER2-enriched type—docetaxel + carboplatin + trastuzumab + pertuzumab; and 3) palliative type—epirubicin + docetaxel.

Characteristics of Patients
As the target Ce of propofol increased, both the MOAA/S scores and the BIS values decreased (Fig. 1A). The BIS values with MOAA/S scores of 3 and 1 were lower in group C than in group N. When the MOAA/S score was 3, the BIS values in groups C and N were 70.54 ± 9.10 and 75.12 ± 5.62, respectively (P = 0.037). When the MOAA/S score was 1, the BIS values for groups C and N were 63.83 ± 6.99 and 68.68 ± 5.63, respectively (P = 0.010). Fig. 1B shows the Ce of propofol for each MOAA/S score. There was no difference in the Ce values for each MOAA/S score between the two groups. The Ce values with a MOAA/S score of 3 in groups C and N were 2.68 ± 0.27 and 2.60 ± 0.24, respectively (P = 0.289). The Ce values with a MOAA/S score of 1 in groups C and N were 2.76 ± 0.29 and 2.67 ± 0.27, respectively (P = 0.285). The BIS and Ce values at LVC and LOC are shown in Fig. 2. Comparisons of the BIS and Ce values at LVC and LOC and the time taken to reach LVC and LOC are summarized in Table 2. There was no difference in Ce values between the LVC and LOC groups, but the BIS value at LOC was lower in group C than in group N (P = 0.018). Table 3 summarizes the PD parameter estimates, along with the standard error and median parameter values (2.5% and 97.5%, respectively) of the nonparametric bootstrap replicates of the final PD model for each MOAA/S score. Table 4 summarizes the PD parameter estimates along with the standard error and median parameter values (2.5% and 97.5%, respectively) of the nonparametric bootstrap replicates of the final PD model for BIS. A history of neoadjuvant chemotherapy was not a significant covariate. The relationship between the Ce of propofol and BIS is shown in Fig. 3.
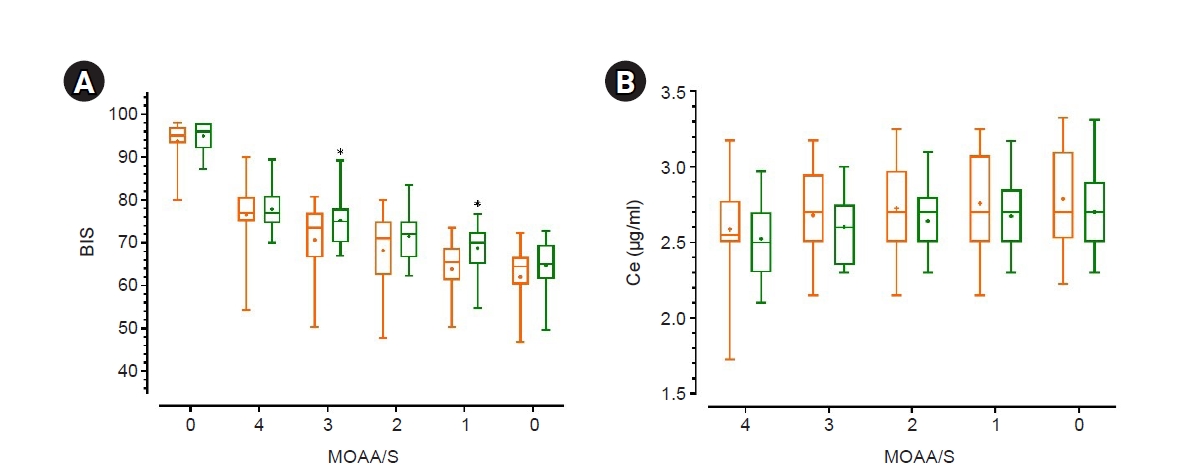
(A) BIS value for each MOAA/S score (B) Ce of propofol for each MOAA/S score. Orange: group C (those who received neoadjuvant chemotherapy for the treatment of breast cancer), Green: group N (those who never received chemotherapy). In this box-and-whisker plot, the center line of the box represents the median value, whiskers are 2.5–97.5 percentiles, and the plus sign (+) represents the mean value. BIS: Bispectral Index, Ce: effect-site concentration of propofol, MOAA/S: Modified Observer’s Alertness/Sedation scale. *Group C vs. Group N, t-test, P value < 0.05.

(A) BIS values at LVC and LOC (B) Ce of propofol for LVC and LOC. Orange: group C (those who received neoadjuvant chemotherapy for the treatment of breast cancer), green: group N (those who never received chemotherapy), middle bold line and error bar: median and 95% CI, gray circle: individual’s value. BIS: Bispectral Index, Ce: effect-site concentration of propofol, CI: confidence interval, LVC: loss of verbal contact (when the Modified Observer’s Alertness/Sedation [MOAA/S] score was 3 or 2), LOC: loss of consciousness (when the MOAA/S score was 1 or 0).

Comparisons of BIS and Ce of Propofol at LVC and LOC, and Time Spent on LVC and LOC

Results of PD Modeling for the Relationship between Ce of Propofol and MOAA/S Score

Results of PD Modeling for the Relationship between Ce of Propofol and BIS Values
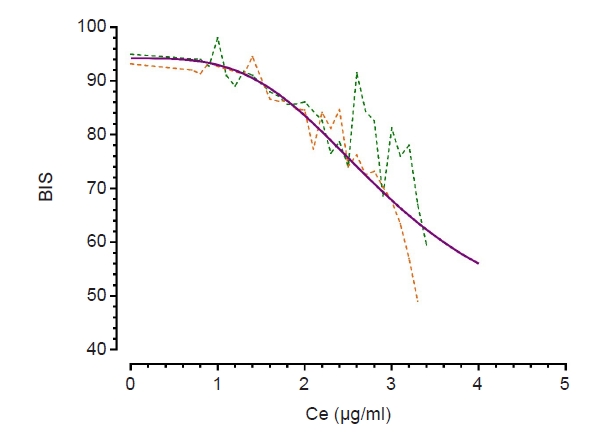
Relationship between Ce of propofol and BIS. A dotted orange line is drawn with actual data obtained from group C, a dotted green line is drawn with actual data obtained from group N, and a purple line is drawn with calculated data based on the final PD model. Group C: those who received neoadjuvant chemotherapy for the treatment of breast cancer, Group N: those who never received chemotherapy, Ce: effect-site concentration of propofol, BIS: Bispectral Index, PD: pharmacodynamic.
DISCUSSION
This study found no difference in the Ce of propofol for each sedation level between groups C (patients who received neoadjuvant chemotherapy for breast cancer) and N (patients who never received chemotherapy). The Ce values for LVC in groups C and N were 2.68 ± 0.28 and 2.60 ± 0.24 μg/ml, respectively (P = 0.289). The Ce values for LOC in groups C and N were 2.76 ± 0.29 and 2.67 ± 0.27 μg/ml, respectively (P = 0.285). These results are similar to those reported by Ki et al. [15], who determined whether chemotherapy drugs used to treat colorectal cancer influenced the Ce of propofol for sedation, reporting that chemotherapy had no effect on the Ce of propofol for LVC and LOC in patients with colorectal cancer. The Ce values of propofol for LVC in the chemotherapy and non-chemotherapy groups were 2.40 ± 0.39 and 2.29 ± 0.39 μg/ml (P = 0.286), respectively, and those for LOC in the chemotherapy and non-chemotherapy groups were 2.69 ± 0.43 and 2.50 ± 0.36 μg/ml (P = 0.069), respectively [15].
However, some studies have reported different results [12,14]. He et al. [14] compared the differences between the three groups (non-adjuvant chemotherapy group [group NP], taxol group [group TP], and cyclophosphamide + adriamycin + 5-fluorouracil [group CP]) and calculated Ce50 at LOC (defined as loss of eyelash reflex and loss of response to a verbal command) by probit analysis. He et al. [14] reported that the Ce50 values of propofol for LOC in the TP and CP groups were lower than that in the NP group (NP: 4.11 μg/ml, group TP: 3.41 μg/ml, CP: 3.60 μg/ml). In our study, the values of Ce50 for MOAAS/S score = 1 (MOAAS/S score = 1 means that a patient responds only after painful trapezius squeeze, and MOAA/S score ≤ 1 means LOC in our study) in groups C and N were 3.06 and 2.86 μg/ml, respectively. These contrasting results may be explained by the following. First, the methods used for propofol administration are different. We used the Schinider model [16], which is the most commonly used model for propofol effect-site TCI infusion, whereas He et al. [14] used the Arden model. In addition, we initiated propofol infusion at 1.5 μg/ml Ce, increasing it by 0.2 μg/ml, whereas He et al. [14] initiated infusion at 3.0 μg/ml Ce, increasing it by 0.3 μg/ml. Second, the neoadjuvant chemotherapy regimen administered to the enrolled patients was different in each study. Kesler and Blayney [20] compared the effects of anthracycline (adriamycin) and non-anthracycline regimens on cognitive status and functional brain connectivity in breast cancer survivors. In their results, the anthracycline group demonstrated significantly lower verbal memory performance, including immediate recall, delayed recall, and lower left precuneus connectivity, than the other two groups (non-anthracycline and non-chemotherapy groups) [20]. Among the 24 patients, 9 received the anthracycline regimen in our study. If the study had been subdivided according to the type of chemotherapy regimen, the results of our study may differ. Third, there were differences between the statistical methods used. While we compared the Ce (the target Ce value we set during the study) of the two groups using the t-test and calculated Ce50 by PD modeling with the sigmoid Emax model using the NONMEM software, He et al. [14] only calculated Ce50 by probit analysis without direct comparison of Ce values. In the results of He et al. [14], although the calculated Ce50 values in TP and CP were lower than that in NP, it was uncertain whether the differences were statistically significant.
Moreover, our results demonstrated that the BIS value at the LOC in group C was lower than that in group N. The BIS values in groups C and N were 63.87 ± 7.04 and 68.44 ± 6.01, respectively (P = 0.018). However, there was no difference in the amount of propofol infused until LOC between the two groups. Ki et al. [15] also reported that the BIS values for LOC in the chemotherapy and non-chemotherapy groups were 66.93 ± 8.82 and 71.75 ± 5.77 (P = 0.018), respectively. Several studies have revealed the influence of chemotherapy on brain structure and functional brain connectivity, which is termed as “chemobrain” [8,10,20-22]. We suspected that these chemotherapy-induced changes might be related to the low BIS value in the neoadjuvant chemotherapy group. Kesler and Blayney [20] studied the neurotoxic effects of anthracycline in breast cancer survivors using resting-state functional magnetic resonance imaging (MRI) and high-resolution anatomic MRI, as well as a clinical cognitive status test. They found that the patients treated with anthracycline demonstrated significantly lower left precuneus connectivity within the frontal, hippocampal, and lateral parietal regions and indicated that disrupted intrinsic connectivity decreased the efficiency of information processing and reduced the brain network’s capacity for a dynamic functional response. In addition, Inagaki et al. [21] reported that in breast cancer survivors, compared with the non-chemotherapy group, the adjuvant chemotherapy group had smaller gray matter and white matter volumes, including the prefrontal, parahippocampal, and cingulate gyri and precuneus, on MRI scans taken within 1 year after cancer surgery. In a study by Yun et al. [22], the consistent findings of MRI studies on breast cancer survivors who received chemotherapy were as follows: 1) brain volume loss in the frontal and temporal regions; 2) impaired connectivity of the default mode network, especially the superior frontal gyrus and the medial prefrontal cortex, and abnormal small-world properties; 3) altered perfusion in the precentral gyrus and bilateral frontal and parietal lobes; 4) altered resting brain activity in the prefrontal lobe, posterior cingulate gyrus, precuneus, and cerebellum; and 5) different activations in the bilateral frontoparietal network, cerebellum, anterior cingulate, and occipitotemporal cortex in different tasks.
Our study had several limitations. First, we did not analyze the data according to chemotherapy regimen because of the insufficient number of enrolled patients. As neoadjuvant chemotherapy regimens vary (the treatment regimen becomes more diverse when considering endocrine and hormonal therapies), future studies must increase the number of participants for each chemotherapy regimen. Second, stimulating the patient to check the MOAA/S score may have caused a bias in the BIS values. Third, MRI and electroencephalogram could have been used to demonstrate changes in the brain structure and functional connectivity.
In conclusion, in this study, no significant differences were observed in the Ce values of propofol at each sedation level between the neoadjuvant chemotherapy and non-chemotherapy groups. We do not recommend reducing the dose of propofol for the induction of anesthesia in patients who have received neoadjuvant chemotherapy for breast cancer. Moreover, even at the same level of sedation, the BIS value may be lower in patients who received neoadjuvant chemotherapy for breast cancer than in those who did not.
Notes
FUNDING
None.
CONFLICTS OF INTEREST
No potential conflict of interest relevant to this article was reported.
DATA AVAILABILITY STATEMENT
The datasets generated during and/or analyzed during the current study are not publicly available due [REASON WHY DATA ARE NOT PUBLIC] but are available from the corresponding author on reasonable request.
AUTHOR CONTRIBUTIONS
Conceptualization: Myounghun Kim, Seunghee Ki. Data curation: Beomseok Choi. Formal analysis: Jeonghan Lee, Jinhyeok Kim, Seunghee Ki. Methodology: Seunghee Ki. Writing - original draft: Jinhyeok Kim. Writing - review & editing: Seunghee Ki. Investigation: Myounghun Kim, Jinhyeok Kim, Beomseok Choi. Supervision: Jeonghan Lee.
Acknowledgements
The authors thank Bobae Kim (Nurse, Inje University Busan Paik Hospital) for her assistance in this study.