Preoperative echocardiography as a predictor of spinal anesthesia-induced hypotension in older patients with mild left ventricular diastolic dysfunction: a retrospective observational study
Article information

Abstract
Background
Spinal anesthesia-induced hypotension (SAH) frequently occurs in older patients, many of whom have mild left ventricular (LV) diastolic dysfunction, often asymptomatic at rest. This study investigated the association between preoperative echocardiographic measurements and SAH in older patients with mild LV diastolic dysfunction.
Methods
We conducted a retrospective observational study using data from electronic medical records. The patients ≥ 65 years old who underwent spinal anesthesia for urologic surgery between January 2016 and December 2017 and whose preoperative echocardiography within 6 months before surgery revealed grade I LV diastolic dysfunction were recruited. SAH was investigated using the anesthesia records. Logistic regression and receiver operating characteristic (ROC) curve analyses were performed.
Results
A total of 163 patients were analyzed. SAH and significant SAH developed in 55 (33.7%) patients. The mitral inflow E velocity was an independent risk factor for SAH (odds ratio [OR], 0.886; 95% confidence interval [CI], 0.845–0.929; P < 0.001). The area under the ROC curve for mitral inflow E velocity to predict SAH was 0.819 (95% CI, 0.752–0.875; P < 0.001). If mitral inflow E velocity was ≤ 60 cm/s, SAH was predicted with a sensitivity of 83.6% and specificity of 70.4%.
Conclusions
The preoperative mitral inflow E velocity demonstrated the greatest predictability of SAH in older patients with mild LV diastolic dysfunction. This may assist in identifying patients at high risk of SAH and guiding preventive strategies in the future.
INTRODUCTION
Perioperative hypotension, even for a few minutes, is significantly associated with postoperative mortality and morbidity. Maintaining intraoperative hemodynamic stability is the primary goal of anesthesia providers [1,2]. Spinal anesthesia-induced hypotension (SAH) is a common complication of intrathecal injections of local anesthetics. This results from decreased sympathetic flow, which leads to reduced systemic vascular resistance (SVR). Peripheral pooling of blood reduces venous return and stroke volume, which may further decrease cardiac output in combination with bradycardia [3]. Spinal anesthesia is frequently administered to older patients, such as during orthopedic and urologic surgeries, to avoid complications related to general anesthesia. However, older age is a well-recognized independent risk factor for SAH [4,5]. Recent studies have investigated the mechanism of SAH in older patients using echocardiography and noninvasive cardiac monitoring [4,6,7]. These studies showed that decreased cardiac output was a more attributable cause of SAH in older adults than was decreased SVR. In addition, the left ventricular (LV) systolic function was normal before and after intrathecal injection, highlighting the contribution of impaired LV diastolic dysfunction to SAH [8].
After sympathetic blockade induced by spinal anesthesia, due to the diminished cardiac compensatory reserve in older patients with LV diastolic dysfunction, including stiff ventricles, increased vagal tone, and decreased baroreceptor reflex, SAH might easily develop [9]. The prevalence of LV diastolic dysfunction in the general population is approximately 30%; however, it increases to 65–86% in geriatric patients [10,11]. Patients with LV diastolic dysfunction are often asymptomatic at rest, which may only be apparent when the cardiovascular system in these patients becomes stressed, such as during surgery [12]. Clinically, identifying patients with LV diastolic dysfunction is difficult, particularly if their grades are mild.
In previous studies of SAH in geriatric patients, the study population did not focus on patients with asymptomatic LV diastolic dysfunction [4,6,7]. Patients with symptomatic cardiac diseases, such as heart failure with decreased ejection fraction or moderate-to-severe valvular heart disease, are high-risk patients and should be managed with special caution. However, based on the prevalence of asymptomatic LV diastolic dysfunction, many older patients may be at a higher risk of developing SAH than expected [10,11]. Additionally, in these studies, echocardiography was performed immediately before the induction of spinal anesthesia, which is difficult to adopt in practice considering the timely availability of the operating room and echocardiography expert.
We hypothesized that preoperative echocardiographic measurements related to the LV diastolic function could predict SAH in older patients. Therefore, we retrospectively investigated the association between preoperative echocardiographic measurements and SAH in older patients with mild LV diastolic dysfunction who underwent spinal anesthesia.
MATERIALS AND METHODS
Study design and patients
Ethical approval for this retrospective, observational, single-center study was provided by the Institutional Review Board of Pusan National University Hospital, Republic of Korea (No. H-1909-003-082; September 17, 2019), and the need for written consent was waived. Inclusion criteria were as follows: (1) ≥ 65 years old; (2) Holmium laser enucleation of the prostate (HoLEP) under spinal anesthesia between January 2016 and December 2017. The exclusion criteria were as follows: (1) patients with American Society of Anesthesiologists physical status classification ≥ IV; (2) obesity (body mass index [BMI] ≥ 30 kg/m2); (3) significant cardiac disease (grade II ≥ LV diastolic dysfunction, arrhythmia, pacemaker, LV or RV heart failure, moderate to severe valvular heart disease); (4) patients with missing data for more than 10 consecutive min during 20 min after intrathecal injection; (5) absence of preoperative transthoracic echocardiography (TTE) records within 6 months before surgery.
Spinal anesthesia
The institutional protocol for spinal anesthesia in urological surgery has been standardized. Upon arrival in the operating room, patients were monitored in the supine position using electrocardiography, non-invasive blood pressure (BP), and pulse oximetry. An intrathecal injection was administered to the patient in the lateral decubitus position, with a lumbar puncture midline at L3/4 or L4/5 using a Quincke 25-guage needle. A standard dose of hyperbaric bupivacaine 0.5% (10–12 mg, depending on the patient’s condition) was injected into the intrathecal space with the needle orifice oriented cranially. Immediately after intrathecal injection, the patients were returned to the supine position. A balanced crystalloid solution (5 ml/kg) was administered during the procedure. When systolic BP ≤ 90 mmHg occurs, the patient is initially treated with 200 ml of a balanced crystalloid solution. If hypotension persists for 3 min, 5–10 mg of ephedrine is administered intravenously and repeated every 3 min, or a vasopressor is infused continuously, depending on the subsequent improvement. If the HR was < 50 beats/min, the patient was treated with intravenous atropine (0.5 mg).
Data collection
Demographic data, medical history, and American Society of Anesthesiologists physical status were reviewed and collected from the electronic medical records. Preoperative TTE measurements regarding LV systolic and diastolic function and intraoperative anesthesia data, including bupivacaine dose and sensory level of blockade at 5 min, were collected. For primary outcomes, the development of hypotension and ephedrine, atropine, or vasopressor use after intrathecal injection were also investigated. SAH was defined if an episode of systolic BP falling to more than 20% of baseline BP occurred within 20 min after intrathecal injection. If ephedrine or atropine was injected more than twice or phenylephrine or norepinephrine was administrated, it was considered significant SAH [13].
Statistical analysis
All continuous variables were tested for normal distribution using the Kolmogorov–Smirnov test. Data are expressed as mean ± standard deviation, median (1Q, 3Q), or number (%), as appropriate. A student’s t-test, or Mann–Whitney U test, was used to compare continuous variables between patients with and without SAH according to distribution. Categorical variables were analyzed using the chi-square test or Fisher’s exact test if any cell had an expected count of < 5. The association with SAH occurrence was analyzed using univariate and multivariate logistic regression analyses. We selected factors significantly associated with SAH in the univariate analysis (P < 0.1). If multicollinearity between the variables was suspected, a more clinically relevant variable was chosen for the model. Candidate variables were entered into a backward multivariate logistic regression. If preoperative TTE measurements were selected in the multivariate logistic regression analysis, their ability to predict SAH was tested using the receiver operating characteristic (ROC) curves with a 95% confidence interval (CI). The optimal cutoff value was selected to maximize the Youden index. The same statistical analyses were performed for the significant SAH. ROC curve analysis was performed to evaluate the predictive accuracy of the logistic regression model. Statistical significance was set at P < 0.05, which was considered significant. Data were analyzed using MedCalc for Windows (version 22.013, MedCalc Software Ltd.) and SPSS Statistics (version 25.0, SPSS Inc.).
RESULTS
During the study period, 306 patients underwent preoperative TTE examination and HoLEP under spinal anesthesia. After excluding 143 patients based on the exclusion criteria, 163 patients were included in the final analysis (Fig. 1). SAH and significant SAH developed in 55 (33.7%) and 30 (18.4%) patients, respectively. Demographic data were comparable between patients with and without SAH, except for age, which was significantly higher in patients who developed SAH (P = 0.024; Table 1). For significant SAH, BMI was greater in patients who developed significant SAH (P = 0.036; Supplementary Table 1). In addition, a higher level of sensory blockade was detected in patients with significant SAH (P = 0.002; Supplementary Table 1).

Flow diagram. ASA: American Society of Anesthesiologists, BMI: body mass index.
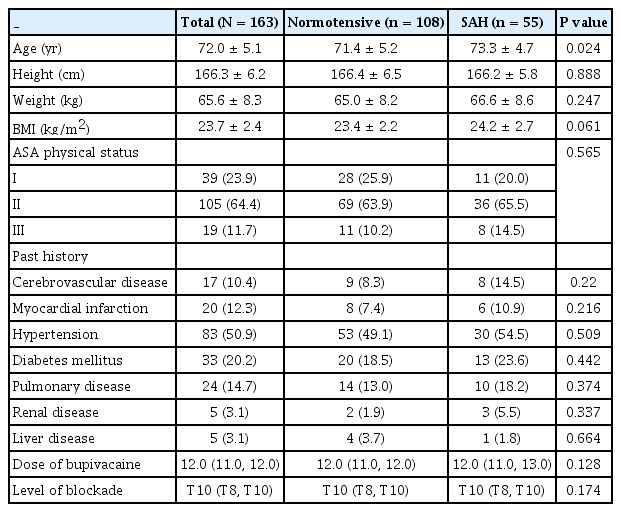
Patient Characteristics and Intraoperative Data
Significant differences in the preoperative TTE measurements existed between patients with and without SAH (Table 2). The mitral inflow E velocity was markedly lower in patients who developed SAH (P < 0.001), whereas the mitral inflow A velocity was also significantly lower (P = 0.018). Because the reduction in the mitral inflow E velocity was greater than that in the mitral inflow A velocity, the E/A ratio was significantly lower in patients with SAH (P < 0.001). The medial and lateral E’ velocities between patients with and without SAH were also significantly lower in patients with SAH (P = 0.008 and 0.002, respectively), as was the left atrium (LA) volume index (P = 0.044). However, differences were only observed in mitral inflow E velocity and medial and lateral E’ velocities between patients with and without significant SAH (Supplementary Table 2).

Preoperative Transthoracic Echocardiographic Measurements
Table 3 shows univariate and multivariate logistic regression analyses to identify the risk factors for the development of SAH and significant SAH. Mitral inflow E velocity was the independent risk factor for both SAH (OR, 0.886; 95% CI, 0.845–0.929; P < 0.001) and significant SAH (OR, 0.936; 95% CI, 0.901–0.973; P = 0.001). However, BMI was another risk factor for SAH (OR, 1.294; 95% CI, 1.077–1.555; P = 0.006), while level of sensory block was only selected as a risk factor for significant SAH (OR, 0.741; 95% CI, 0.604–0.910; P = 0.004). The AUC of the multivariate logistic regression model for SAH was 0.849 (95% CI, 0.777–0.905) and 0.789 (95% CI, 0.718–0.849) for significant SAH.

Univariate and Multivariate Logistic Regression of Variables Associated with SAH and Significant SAH
The area under the ROC curve for mitral inflow E velocity to predict SAH was 0.819 (95% CI, 0.752–0.875; P < 0.001) (Table 4, Fig. 2A). If mitral inflow E velocity was ≤ 60 cm/s, SAH was predicted with a sensitivity of 83.6% and a specificity of 70.4%. The area under the ROC curve for mitral inflow E velocity to predict significant SAH was 0.741 (95% CI, 0.666–0.806; P < 0.001) (Table 4, Fig. 2B). If mitral inflow E velocity was ≤ 59 cm/s, significant SAH was predicted with a sensitivity of 83.3% and a specificity of 63.2%.

Receiver Operating Characteristic Analysis of Mitral Inflow E Velocity to Predict SAH and Significant SAH
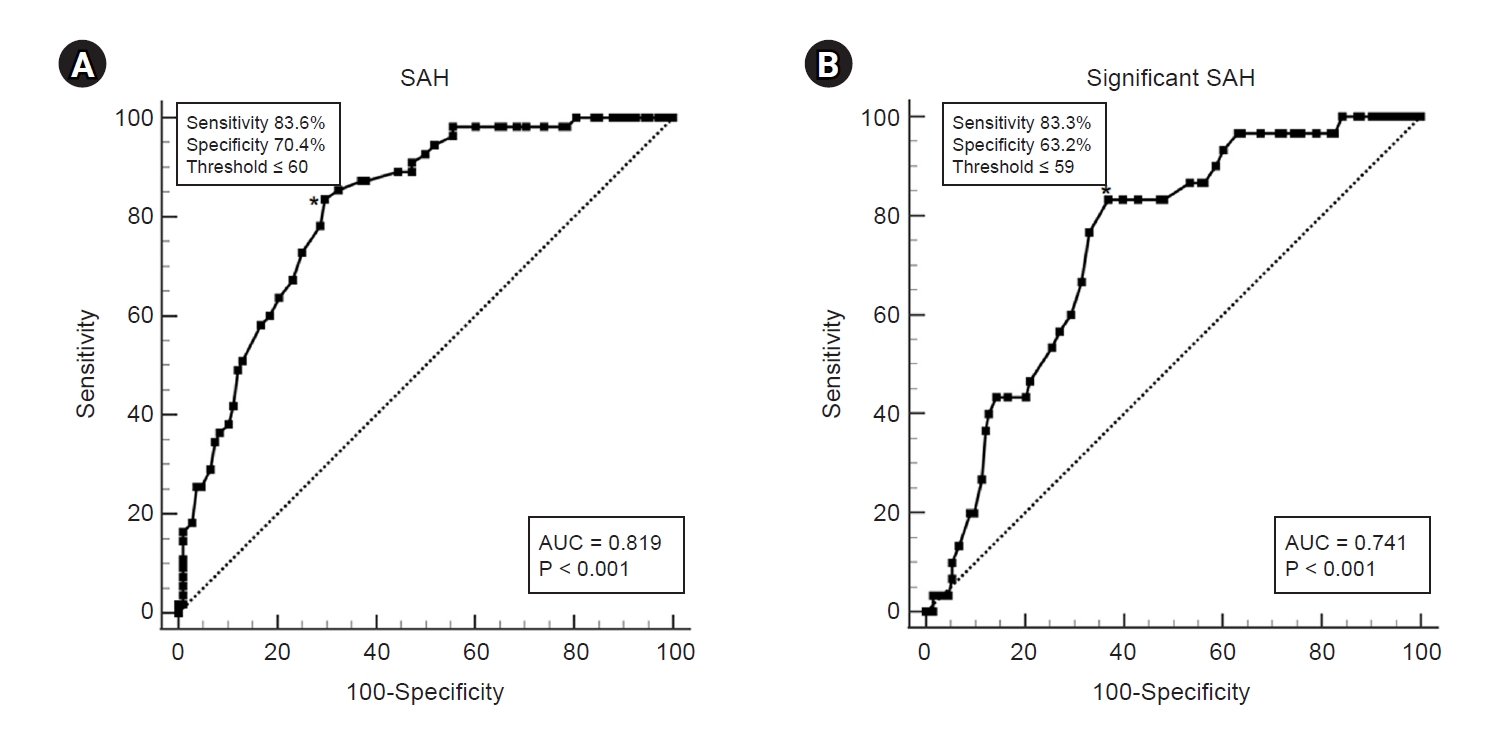
ROC curve analysis on mitral inflow M velocity for SAH (A) and significant SAH (B). AUC: area under the curve, SAH: spinal anesthesia-induced hypotension; ROC: receiver operating characteristic. *Represents cutoff value.
DISCUSSION
This study showed that the mitral inflow E velocity could be an independent predictor of both SAH and significant SAH in older patients with grade I LV diastolic dysfunction. However, other preoperative TTE measurements were not considered as risk factors for SAH or significant SAH. The mitral inflow E velocity represents peak early filling, primarily reflecting the LA-LV pressure gradient during early diastole, and is therefore affected by preload and alterations in LV relaxation [14]. In the early phase of LV diastolic dysfunction, the mitral inflow E velocity decreased as LV compliance decreased. An LV with abnormal relaxation has a steeper and upward end-diastolic pressure-volume relationship, in which small changes in end-diastolic volume would lead to a greater reduced stroke volume compared to a normal LV [15]. However, if LV diastolic dysfunction is aggravated by pseudonormal or restrictive filling patterns, the mitral inflow E velocity cannot be a predictor of SAH. LA pressure and the LA-LV pressure gradient would begin to increase in advance, resulting in an increased mitral inflow E velocity. A previous study that showed inconsistent results with our current study included mixed grades of LV diastolic dysfunction, which might have offset the significant differences in mitral inflow measurements [16].
There have been several previous studies attempting to predict SAH using TTE. Although the majority of them utilized inferior vena cava (IVC) diameter collapsibility, there was significant variation in predictability [7,17,18]. According to a recent meta-analysis, the maximum and minimum reported sensitivities of the IVC collapsibility index (IVCCI) for predicting SAH were 84.6% and 58.8%, respectively, whereas the maximum and minimum specificities were 93.1% and 23.5%, respectively [7]. The change in IVC diameter with phases of respiration depends not only on intravascular volume but also on the depth of respiration [19]. A previous study demonstrated that IVCCI increased by 40% with high inspiratory effort compared to low inspiratory effort [20]. As respiration is a process of IVCCI measurement, it significantly influences the results. The problem is that it is difficult to standardize or quantify respiratory efforts in spontaneously breathing patients. Of course, respiration could also affect the mitral inflow E velocity. However, under normal circumstances, the peak velocity of mitral inflow varies by less than 15% during respiration [21]. Additionally, IVCCI is not routinely performed in preoperative TTE examinations because it is used to evaluate volume responsiveness. In contrast, mitral inflow E velocity is an essential component for evaluating LV diastolic function [14]. Excellent-quality mitral inflow waveforms can be achieved in nearly all patients, and measurements can be easily obtained. Therefore, among the preoperative TTE parameters, the mitral inflow E velocity may be a clinically relevant and feasible indicator.
The main purpose of our study was to identify the correlation between preoperative TTE measurements and the development of SAH, and mitral inflow E velocity was found to be an independent predictor. In this study, preoperative TTE data were analyzed under the assumption that the overall condition of elective surgery patients remains relatively stable within six months before surgery. Therefore, the study was conducted on HoLEP surgery patients who were expected to have relatively little changes in the cardiovascular system and who mainly underwent spinal anesthesia. It is difficult to consider that the cardiovascular system at the time of the TTE examination accurately reflects the state just before surgery. However, in clinical practice, it is almost impossible to perform the TTE in the operating room immediately before surgery. Considering that patients with lower mitral inflow E velocity are more sensitive to changes in cardiac output, our study emphasizes the clinical significance of using preoperative TTE results to identify high-risk patients and prevent the decrease in cardiac output due to spinal anesthesia. Changes in preload, such as fasting before surgery, may affect mitral inflow E velocity. Therefore, finding preventive strategies for SAH with reduced mitral inflow E velocity in mild LV diastolic dysfunction is an area that requires further research in the future. The strategies such as preoperative carbohydrate loading, vasopressor use, or co-administration of intravascular fluid may be considered.
It is not clear why mitral inflow E velocity was selected as the most predictable measurement for both SAH and significant SAH compared with other measurements such as mitral inflow A velocity, mitral annular velocities, and LA volume index. The mitral inflow E velocity is affected mainly by preloading and alterations in LV relaxation [22]. Since patients were not required to fast before TTE examination, they were likely to be in an unstressed condition. Hence, the mitral inflow E velocity well reflects LV diastolic dysfunction. Also, mitral inflow E velocity can reflect stroke volume as well in the absence of significant valvular heart disease [23,24]. In contrast, mitral inflow A velocity is influenced not only by LV compliance but also by LA contraction, which is dependent on early diastolic mitral inflow [14]. Medial and lateral mitral annular velocities are useful judgments when the mitral inflow pattern becomes “pseudonormalized.” Importantly, it is directly related to the elastic contraction of the left ventricular muscle and does not represent a reduction in LA and LV filling pressure, or stroke volume. LA volume index is known as an indicator reflecting left ventricular diastolic dysfunction, as it increases with the elevation of left ventricular filling pressure [14]. However, because this is a morphological change that occurs when the period of left ventricular diastolic dysfunction is prolonged, this index is often normal in patients with Grade I diastolic dysfunction [25]. Because of this, it appears that it was not selected as a final variable in this study, which included patients before they progressed to the stage of Grade II pseudonormalization, where pressures decrease again with increasing LA volume [14]. Additionally, it may be technically difficult to obtain a clear image of the LV volume index with TTE when LA foreshortening occurs.
Our results showed that mitral inflow A velocity, mitral annular velocity, and LA volume index were significant risk factors before adjustment. However, SAH develops mainly because of reduced cardiac output in older individuals [4,26]. Among the mitral inflow measurements, mitral inflow E velocity might be the most direct and independent indicator of reduced cardiac output caused by spinal anesthesia in patients with mildly impaired diastolic function. In context, the cutoff point for SAH may indicate the threshold for maintaining hemodynamic stability under stressful conditions. The normal range of mitral inflow E velocity is known to vary with gender and age. For male over 65 years of age, the average is reported to be 60–80 cm/s [27,28]. In this study, 60 cm/s for SAH and 59 cm/s for significant SAH were selected as cutoff values. Therefore, it can be assumed that SAH occurred when the velocity was lower than average. However, because this study had a small sample size, it is difficult to recommend generalizing the cutoff value and applying it to other patients.
BMI was another predictor of SAH. There has been a debate over whether obesity is a risk factor for SAH or not [3,29]. With obesity, increases in abdominal and epidural fat reduce lumbosacral CSF volume and contribute to a greater degree of cephalad spread by local anesthetics [30,31]. Therefore, in our study, patients with BMI > 30 kg/m2 were excluded to reduce this influence when analyzing the association between SAH and preoperative TTE. However, despite excluding obese patients from the study population, it is assumed that high BMI was selected as a risk factor for SAH in our study and that it may be due to a similar mechanism. The sensory block level was selected as an independent risk factor for significant SAH, a well-known risk factor for SAH. Therefore, strategies to minimize the effective dose of local anesthetics and prevent further cephalad spread have been investigated [32-35]. In our study, the effects of a high level of sensory block were powerful enough to eliminate other mitral inflow measurements after adjustment, except for the mitral inflow E velocity, in significant SAH.
Our study had several limitations. First, it may have limited generalizability. Only males who underwent prostate surgery were included. And because 115 out of 306 patients did not undergo TTE examination, it would be difficult to apply the results of this study to all older patients receiving spinal anesthesia. However, since patients undergoing TTE examination are generally those with high cardiovascular risk, it is clinically meaningful to select those at high risk for hypotension after spinal anesthesia. Additionally, our results are applicable only to patients with mild diastolic LV dysfunction. However, considering that grade I dysfunction accounts for the largest proportion of patients with diastolic dysfunction, it can also be applied to many older patients [32]. Second, since this was a retrospective analysis of medical records and few studies have investigated preoperative TTE and SAH, we did not calculate the sample size or statistical power. Therefore, no conclusions can be confirmed, and further prospective studies are required.
In conclusion, preoperative mitral inflow E velocity demonstrated the greatest predictability of SAH in older patients with grade I LV diastolic dysfunction. This may assist in identifying patients at high risk for intraoperative hypotension after spinal anesthesia and may be conducive to preventive strategies in the future.
SUPPLEMENTARY MATERIALS
Supplementary data is available at https://doi.org/10.17085/apm.23161.
Patient characteristics and intraoperative data for the patients with and without significant SAH
Preoperative transthoracic echocardiographic measurements for the patients with and without significant SAH
Notes
FUNDING
This work was supported by a clinical research grant from the Pusan National University Hospital in 2023 Preoperative echocardiography as a predictor of spinal anesthesia-induced hypotension in older patients with mild left ventricular diastolic dysfunction: a retrospective observational study.
CONFLICTS OF INTEREST
No potential conflict of interest relevant to this article was reported.
DATA AVAILABILITY STATEMENT
The datasets generated during and/or analyzed during the current study are available from the corresponding author on reasonable request.
AUTHOR CONTRIBUTIONS
Writing - original draft: Ah-Reum Cho, Eun Ji Park, Hyae-Jin Kim, Hyeon-Jeong Lee, Soeun Jeon, Jiseok Baik, Wangseok Do, Yerin Kang. Writing - review & editing: Ah-Reum Cho, Eun Ji Park, Hyae-Jin Kim, Hyeon-Jeong Lee, Soeun Jeon, Jiseok Baik, Wangseok Do, Yerin Kang. Conceptualization: Ah-Reum Cho, Eun Ji Park, Hyeon-Jeong Lee. Data curation: Ah-Reum Cho, Eun Ji Park, Hyae-Jin Kim, Wangseok Do, Yerin Kang. Formal analysis: Ah-Reum Cho, Eun Ji Park, Hyae-Jin Kim, Soeun Jeon, Jiseok Baik. Methodology: Ah-Reum Cho, Eun Ji Park, Soeun Jeon, Jiseok Baik. Project administration: Ah-Reum Cho, Eun Ji Park, Hyeon-Jeong Lee. Funding acquisition: Ah-Reum Cho. Visualization: Ah-Reum Cho, Eun Ji Park, Jiseok Baik. Investigation: Ah-Reum Cho, Eun Ji Park, Hyae-Jin Kim, Wangseok Do. Resources: Ah-Reum Cho, Hyeon-Jeong Lee. Software: Ah-Reum Cho, Eun Ji Park, Soeun Jeon. Supervision: Ah-Reum Cho. Validation: Ah-Reum Cho, Eun Ji Park, Hyae-Jin Kim, Wangseok Do, Yerin Kang.