Effects of pulse pressure alterations on cardiac output measurements derived from analysis of arterial pressure waveform
Article information
Abstract
Background:
Changes in pulse pressure (PP) may alter the morphology of arterial pressure waveforms, thereby affecting the accuracy of cardiac output (CO) measurements derived from such waveforms. This study evaluated the influence of PP on the accuracy of FloTrac/Vigileo™ system-measured CO (APCO). Pulmonary artery catheter (PAC) measured stat mode CO (SCO) is used as a reference standard.
Methods:
Hemodynamic variables were measured at various time points in 24 patients. APCO and SCO were compared using Bland-Altman analysis of the overall data pairs. The data pairs were divided into a low PP group and a high PP group, and subgroup analysis was conducted.
Results:
The mean APCO (5.3 ± 1.7 L/min) was higher than the mean SCO (5.1 ± 1.6 L/min) for all data pairs (P < 0.001). The Bland-Altman analysis revealed an overall percentage error of 41.7% between the APCO and SCO, which exceeds a 30% limit of agreement. There was a significant relationship between PP and the difference between APCO and SCO (P = 0.031, R = 0.151). In subgroup analysis, APCO and SCO showed reasonable agreement in the low PP group, with a percentage error of 28.2%, but decreased agreement in the high PP group, with a percentage error of 43.2%.
Conclusions:
Changes in PP affect the accuracy of APCO measurements. An acceptable level of agreement between APCO and SCO was observed only in a low range of PP.
INTRODUCTION
Cardiac output (CO) measurements are useful for diagnostic purposes and to monitor critically ill patients for which pulmonary artery catheter (PAC) using the thermodilution method has been considered a ‘clinical standard’ [1]. However, simpler and less invasive techniques for determining CO are being sought because PAC is associated with various complications which preclude their use outside of an intensive care unit (ICU) or operating room [2].
The FloTrac/Vigileo™ system (Edwards Lifesciences, Irvine, CA, USA) uses the morphology of the arterial pressure waveform to produce a continuous cardiac output measurement (arterial pressure derived cardiac output, APCO). This method requires only arterial catheterization and its algorithm incorporates the proportionality between pulse pressure (PP) and stroke volume (SV) [3]. However, validation studies on the agreement between measurements from FloTrac/Vigileo™ system and the thermodilution method-based PAC have yielded conflicting results [4-8].
PP, defined as systolic blood pressure (SBP) minus diastolic blood pressure (DBP), is determined by ventricular SV and compliance of arterial tree. The PP increases with exercise because of increased SV [9], and high PP (greater than 45 mmHg) has been shown to be associated with increased arterial stiffness, which may result in cardiovascular disease [10]. A change in vascular stiffness may alter arterial pressure waveform morphology and thus is a potential source of error in APCO measurements. Although some studies have investigated the influence of mean blood pressure (MBP) or systemic vascular resistance (SVR) on APCO measurements [4-6,11-13], the accuracy of the FloTrac/Vigileo™ system has not been evaluated in relation to PP.
We evaluated the influence of PP on the accuracy of CO measured by the FloTrac/Vigileo™ system in patients undergoing cardiac surgery. CO measured by thermodilution using PAC was taken as the gold standard.
MATERIALS AND METHODS
This study was approved by the Institutional Review Board and written informed consent was obtained from all study participants. 24 patients scheduled for elective cardiac surgery were enrolled. The trial was observational and not randomized. Patients with aortic valvular heart disease, cardiac arrhythmias, mitral or tricuspid regurgitation more than grade 2, or peripheral vascular disease were excluded from the study.
Patients’ cardiac medications were continued until the morning of surgery. In the operating room, standard monitoring devices were used, including a PAC (Swan-Ganz CCOmbo CCO/SvO2™, Edwards Lifesciences LLC, Irvine, CA, USA), which was inserted via the right internal jugular vein and connected to an analysis system (Vigilance™, Edwards Life-sciences LLC, Irvine, CA, USA) for continuous monitoring of CO (CCO), stat mode CO (SCO), and mixed venous oxygen saturation (SvO2). The radial artery was cannulated in all patients with a 20-G cannula (Introcan®, B. Braun AG, Melsungen, Germany), which was connected to a FloTrac/Vigileo™ sensor (software version 3.02) to allow for estimation of APCO. All transducers were zeroed at the mid-axillary level and care was taken to ensure that the pressure waveform was not dampened during the study period. All patients received general anesthesia consisting of sufentanil and midazolam and supplemented by sevoflurane in a mixture of oxygen and air. Vecuronium was used for muscle relaxation. Transesophageal echocardiography was used to monitor global and regional left ventricular function from the short-axis transgastric view. After cardiac surgery, patients were admitted to the ICU. The patients were sedated and volume-controlled ventilation was continued for a minimum of 4 h.
The hemodynamic variables obtained included the APCO, SCO, SBP, DBP, MBP, and PP. Five sets of measurements were obtained in the operating room, at the following time points: 10 min after induction of anesthesia, skin incision, sternum opening, main surgical procedure (cardiopulmonary bypass or graft completion in off pump graft bypass surgery), and sternum closure. Several sets of measurements were obtained in the ICU at 60 min intervals until patients awakened. At each time point, measurements were obtained about 5 min after a stable blood pressure was reached, with patients in the supine position.
Based on the results of a previous study [13], we presumed a correlation of −55% between the bias (difference between APCO and SCO) and log PP. Twenty-three subjects were needed with a type I error of 0.05 and a power of 80%. The relationship between the PP and the bias was tested using logarithmic regression.
A Student’s t-test was used to compare the APCO and SCO. Bias and limits of agreement between the APCO and SCO were assessed by Bland-Altman analysis. The limits of agreement were calculated as the bias 2 SD [14]. The percentage error (2 SDs of the bias/mean CO) was calculated according to Critchley and Critchley. A percentage error of 30% or less was established as the criterion for method interchangeability [15]. Because the risk of cardiovascular disease becomes substantial at a PP > 45 mmHg [10], the subjects were divided into two groups according to PP: low PP (≤ 45 mmHg) and high PP (> 45 mmHg), and subgroup analysis comparing the APCO and SCO was conducted using the same statistical methods as above.
Statistical analyses were performed using SPSS statistics version 20 (IBM Corporation, Armonk, NY, USA).
RESULTS
From the 24 patients enrolled, 203 sets of CO measurements were available for comparison between the APCO and SCO. Patient characteristics are presented in Table 1. The relationship between the bias (APCO – SCO) and PP is shown in a log-scale plot. Logarithmic correlation analysis showed a significant relationship between bias and PP (Fig. 1, P = 0.031, R = 0.151).

Patient Characteristics
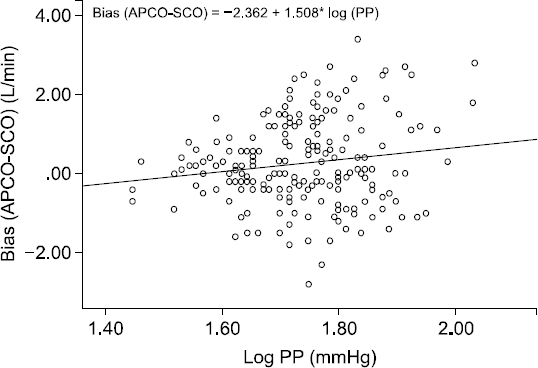
Logarithmic correlation analysis of the relationship between pulse pressure and arterial pressure waveform analysis device for cardiac output (APCO)-a pulmonary artery catheter (SCO). PP: pulse pressure.
Global analysis
Overall, the mean APCO was 5.3 ± 1.7 L/min, which was higher than the mean SCO of 5.1 ± 1.6 L/min (P < 0.001). For all data pairs of APCO and SCO, the Bland-Altman analysis revealed a bias of 0.26 L/min and limits of agreement of −1.87 to 2.39 L/min, resulting in an overall percentage error of 41.7%, which exceeds the 30% limit of acceptance (Fig. 2). The overall agreement between APCO and SCO was unacceptable.
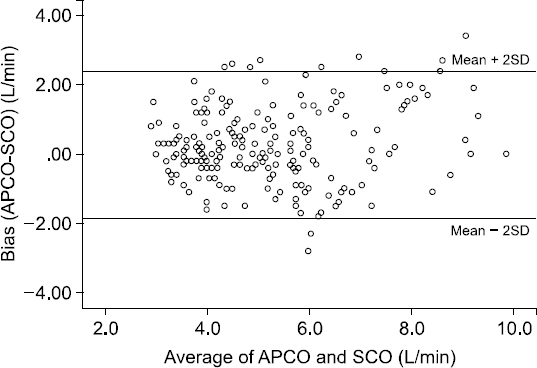
Bland-Altman analysis for cardiac output (CO) measurements by arterial pressure waveform analysis device for cardiac output (APCO) and a pulmonary artery catheter (SCO) for all data. The bias was 0.26 L/min, and limits of agreement were −1.87 to 2.39 L/min, resulting in an overall percentage error of 41.7%.
Subgroup analysis
The data pairs were divided into a low PP group (n = 50, ≤ 45 mmHg) and a high PP group (n = 153, > 45 mmHg). The Bland-Altman analysis for APCO and SCO showed reasonable limits of agreement in the low PP group with a percentage error of 28.2%. However, decreased agreement was observed in the high PP group, with a percentage error of 43.2% (Table 2).

Bland-Altman Analysis for Cardiac Output (CO) Measurements by Arterial Pressure Waveform Analysis Device for Cardiac Output (APCO) and a Pulmonary Artery Catheter (SCO) for the Subgroup Data
DISCUSSION
This observational study demonstrated that PP affects the accuracy of CO measurements taken with the FloTrac/Vigileo™ system. As PP increased, the bias between APCO and SCO increased. And the agreement between APCO and SCO was unacceptable (43.2%). However the agreement between APCO and SCO was acceptable (28.2%) when PP was lower than 45 mmHg.
Accurately measuring CO constitutes an important part of hemodynamic monitoring, as it provides the basis for guiding therapy to ensure adequate tissue perfusion, particularly in cardiac surgery patients. The FloTrac/Vigileo™ system is a less invasive method for monitoring CO, which is based on an algorithm for APCO measurements without external calibration. Despite its benefits, the FloTrac/Vigileo™ system may produce inaccurate measurements of CO. Because the FloTrac/Vigileo™ system calculates CO using arterial waveform characteristics, changes in compliance and resistance of the arterial vascular tree influence the relationship between PP and SV [4], thereby affecting APCO accuracy. Although new software packages have been introduced that have improved performance, various studies continue to show that abnormal SVR ranges are potential sources of error [4-6,11,12].
The arterial tree serves two interrelated functions, conveyance of blood to peripheral tissues and partial dampening of cardiac pulsation to provide a consistent flow at the microcirculatory level. Therefore, attention has been given to PP as a possible independent predictor of cardiovascular disease risk [16]. An increase in PP is associated with an increase in SV, and in the presence of a constant SV, increased central arterial stiffness raises SBP but lowers DBP and contributes to a higher PP [17]. Because the FloTrac/Vigileo™ system calculates CO using arterial waveform analysis, increases in vascular stiffness could be a source of error when measuring APCO. In this study, bias between APCO and SCO had a positive correlation with PP and only APCO measurements in the low PP group, i.e., lower than 45 mmHg, showed acceptable agreement with the SCO.
The third generation of the FloTrac/Vigileo™ system software has reduced the inaccuracy of CO measurements during low peripheral resistance states and has improved the overall precision and trending ability of the system [5,18]. Despite such improvements in performance, the new software cannot yet be said to provide clinically acceptable precision [5]. In the present study, we made comparisons with the updated software (version 3.02), and overall agreement with the SCO was still poor, which is in line with the results of various studies using previous and new versions of the software [5,12]. Our subgroup analysis results revealed that the FloTrac/Vigileo™ system was accurate when PP was low. Our results agree with those of a study by Kotake et al. [19], although those authors used the second-generation software (version 1.10). They suggested that the increase in measurement error was partly attributable to changes in SBP and that the FloTrac/Vigileo™ system has reasonable accuracy during transient hypotension but not during transient hypertension.
This study had some limitations. First, we did not compare CO measurements with intermittent bolus thermodilution cardiac output (ICO) with ice saline. ICO is currently the method of choice for measuring CO in clinical practice. However, ICO has well-known drawbacks related to operator variation, and the injection of iced saline can cause short-lived cardiodepressant effects [20]. Another problem is that CCO measurements have a delayed response time. A trended CCO measurement is displayed every 30 to 60 seconds, which reflects the average flow over the previous 3 to 6 minutes. Because it takes 3 to 6 minutes for a change in CCO value to become apparent, there is a potential for a delay in monitoring. To minimize the response time and potential source of error, we used STAT mode, which averages CO over the last three measurements [21], and each measurements were obtained 5 min after reaching a stable blood pressure. Validation studies have shown that the SCO can replace the ICO [4,22,23].
Second, the participants in this study may have differed from those used to establish the database of the FloTrac/Vigileo™ system. Because the third-generation software used in this study was developed from a human database containing many recordings from patients with sepsis or undergoing liver transplant and performance mainly improved under the hyperdynamic conditions caused by sepsis [5,12], it remains to be seen whether performance of the FloTrac/Vigileo™ system has been improved for other populations.
In conclusion, the accuracy of APCO measurements was affected by PP. As PP increased, the bias between APCO and SCO, the reference CO measurement method, increased. Agreement was observed between the APCO and SCO in cardiac patients with low PP. For high PP ranges, the APCO showed limited agreement with the SCO.