INTRODUCTION
The genicular nerves (GNs) are in close proximity to the adjacent genicular artery (GA), and these small sensory GNs are named for the artery on the posterior anastomosis that they accompany as they traverse the knee joint. The GNs comprise the superior medial genicular nerve (SMGN), superior lateral genicular nerve (SLGN), inferior medial genicular nerve (IMGN), inferior lateral genicular nerve (ILGN), and middle and recurrent tibial GN [1]. The SMGN, SLGN, IMGN, ILGN, and middle GN accompany the superior medial genicular artery (SMGA), superior lateral genicular artery (SLGA), inferior medial genicular artery (IMGA), inferior lateral genicular artery (ILGA) and middle GA, respectively.
Osteoarthritis is a painful and disabling condition that can dramatically influence quality of life, although some patients can be treated successfully with conservative modalities and surgical intervention. For patients who are unable to undergo surgical intervention, GN ablation [2,3] has emerged recently as an alternative intervention. GN ablation involves thermal lesioning of the SLGN, SMGN, and IMGN, which are also sometimes referred to as the retinacular nerves [2,4,5]. Previous studies targeting the GNs have used a bony landmark approach under fluoroscopic guidance [2,4,5].
Recently, the use of ultrasound has been advocated for performing GN blocks, as ultrasound allows visualization of the neurovascular bundles containing the GNs and, presumably, more accurate nerve identification [6,7] compared to traditional fluoroscopy approaches. However, although recent anatomic studies suggest that ultrasound-guided GN block can be performed accurately [8,9], GN visualization remains difficult.
The SMGN, SLGN, and IMGN pass close to the epicondyles of the femur and tibia, accompanying their respective GA [2]. Thus, these arteries are important sonographic landmarks for ultrasound-guided GN blockade or radiofrequency (RF) GN ablation. However, there is little research with respect to ultrasound-guided GA localization at the adductor tubercle and epicondyle-shaft transition.
The first aim of this investigation was to investigate the distance between a GA and relevant bony cortex to ascertain whether ultrasound guidance is a reliable tool for localizing the GA using an X-Y axis structure. Secondly, we estimated localization of GNs at the adductor tubercle and at the level of the femoral and tibial epicondyle-shaft transition using the corresponding GA as a landmark under ultrasound guidance.
MATERIALS AND METHODS
This study was conducted as a prospective evaluation of diagnostic block of genicular nerves on selected patients with osteoarthritis of the knee. All participants provided written informed consent, and the study was approved by the Hospital Ethics Committee (IRB No. 2017-08-011). A total of 24 knees (14 patients) with a diagnosis of knee osteoarthritis were included in the present study. The mean demographic data were as follows: age, 70.1 ± 11.6 years; height, 157.6 ± 5.1 cm; weight, 59.4 ± 7.3 kg; body mass index, 23.8 ± 2.2 kg/m2; male (n): female (n) = 2:12.
The inclusion criteria consisted of the presence of dominant knee pain for more than 6 months and a diagnosis of radiologically verified grade III or IV osteoarthritis according to the Kellgren-Lawrence Grading Scale. Exclusion criteria consisted of a history of knee surgery, presence of acute knee pain with findings of inflammation, a serious psychiatric disorder or neurological disease, sciatica, or current use of anticoagulant drugs.
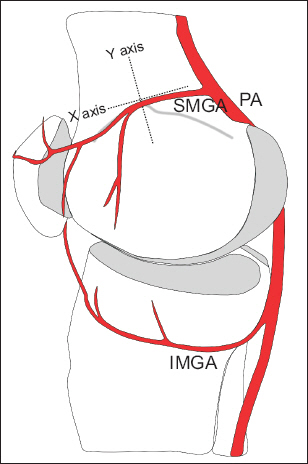
Two important assumptions were made in this study. First, we assumed that the GNs were contiguous with the corresponding GA [6,9], as the GNs are difficult to visualize by ultrasound because of their small size. Thus, in order to estimate GN localization, GA was used as a landmark under the assumption that they share the same trajectory and run closely together. Second, the posterior genicular arterial anastomosis, the origin of which is the popliteal artery, has a large direct termination at the knee [10-13]. Recently, it has been reported that medial anastomosis plays a substantial role in small arterial branches and directly terminates at the knee capsule [14] (Fig. 1). However, we assumed that the GAs originated from the popliteal artery (posterior anastomosis) according to the X-Y axis structure in axial and coronal planes, as shown in Fig. 2.
Other important landmarks are the femoral and tibial cortical surfaces because of their close topographic relation to the genicular neurovascular bundles.
Fig. 1
Illustration showing the posterior and medial anastomoses that form the arterial network surrounding the knee joint. The small arterial direct termination is from the medial anastomosis to the SMGAd via DGA rather than the SMGA from the posterior anastomosis. Posterior anastomosis: gray colored area with dotted line. Medial anastomosis: red colored area. FA: femoral artery, DGA: descending genicular artery, DO: descending osseous branch, SGTA: superior genicular transverse artery, SMGA: superior medial genicular artery, SMGAs: superficial branch of the SMGA, SMGAd: deep branch of the SMGA, SLGA: superior lateral genicular artery, IMGA: inferior medial genicular artery, ILGA: inferior lateral genicular artery.
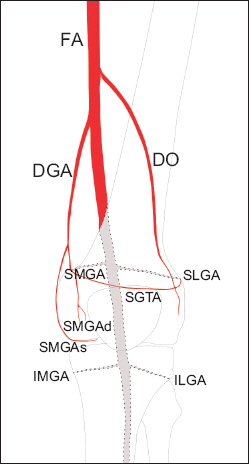
Fig. 2
Simplified drawing showing the medial aspect of the knee and the application of the X-Y axis structure for GA localization. As the small arterial direct termination is mainly from the medial anastomosis to SMGA via DGA, the X-Y axis structure was applied at the adductor tubercle, where the trajectory of the SMGA from the posterior anastomosis is from back to front. GA: genicular artery, PA: popliteal artery, SMGA: superior medial genicular artery, IMGA: inferior medial genicular artery.
Scanning of GA and accompanying GN
The targets were the SMGA, SLGA, and IMGA. Patients were placed in a supine position with a pillow under the popliteal fossa to elevate the knee and make it more comfortable to perform ultrasonography. All procedures were performed using a 13-6 MHz linear transducer (S2, Sonosite Inc., USA).
To scan the SMGA, the transducer was placed longitudinally in a sagittal orientation over the femoral medial epicondyle (Fig. 3B). The transducer was then translated proximally to the level of the adductor tubercle, and the insertion of the adductor magnus tendon was imaged. Keeping the adductor tubercle in the center, the ultrasound probe was rotated on the axial orientation (Fig. 3A). The SMGA and accompanying GN were then visualized as a linear pattern on the transverse view and as a sectional pattern on the longitudinal view (Fig. 4). The pulsating artery meeting these criteria was assumed to be the SMGA. We defined the sectional pattern as the pulsating round hypoechoic shadow with a diameter less than 1.2 mm in longitudinal view and the linear pattern as the pulsating hypoechoic shadow longer than 2.5 mm in transverse view.
Fig. 3
Ultrasound-guided images of GAs. Color enhanced shadows (indicated by the white arrow) represent the GAs. (A) Transverse image of SMGA. (B) Longitudinal image of SMGA. (C) Longitudinal image of SLGA. (D) Longitudinal image of IMGA. GA: genicular artery, SMGA: superior medial genicular artery, SLGA: superior lateral genicular artery, IMGA: inferior medial genicular artery.
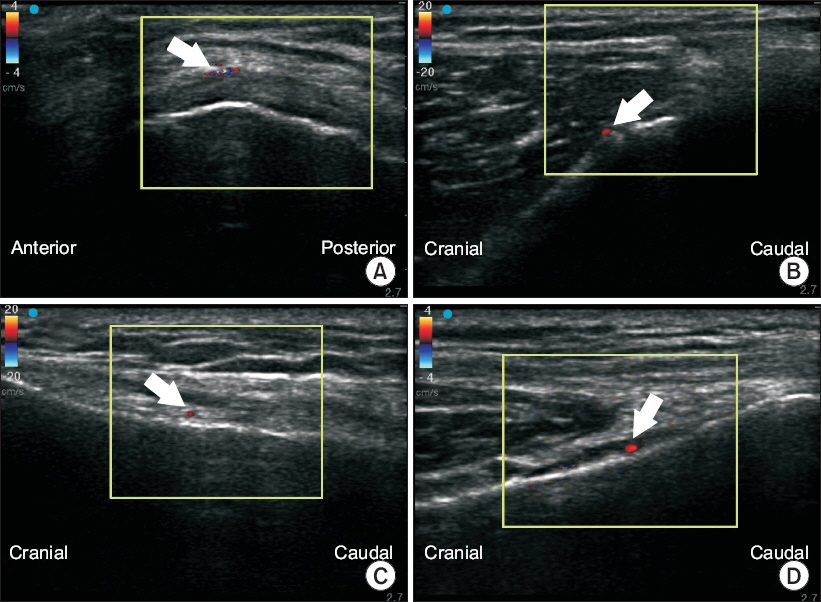
Fig. 4
Illustration showing placement of the ultrasound generator. An ultrasound generator was aligned with the X axis for transverse view and with the Y axis for longitudinal view. PA: popliteal artery. SMGA: superior medial genicular artery.

Originating from the nerve innervating the vastus lateralis, the SLGN is present in the deep surface of the muscle. As the SLGN and accompanying SLGA appear close to the junction of the lateral epicondyle and the shaft of the femur distally [15], the ultrasound probe was placed on this junction in a sagittal orientation to image the bony contour of the lateral femoral epicondyle (Fig. 3C), followed by axial orientation (transverse view). The SLGA and accompanying GN appear as a sectional pattern in the longitudinal view and as a linear pattern in the transverse view. The artery that met these criteria was regarded as the SLGA.
As the IMGN is situated horizontally around the tibial medial epicondyle and passes beneath the medial collateral ligament at the midpoint between the tibial medial epicondyle and the tibial insertion of the medial collateral ligament [8], an ultrasonic probe was placed longitudinal to the tibia, aimed in the center of the junction of the medial tibial epicondyle and tibial shaft to scan the IMGA. In this view, the IMGA and accompanying GN were seen as a sectional pattern (Fig. 3D). In the transverse view achieved by rotating the probe 90 degrees, the observer could identify the IMGA running parallel to the probe. The artery that met this condition was regarded as the IMGA.
When more than two pulsating shadows were observed, we regarded the one closest to the bony cortex as the GA.
Measurement and data collection
An image of the screen was produced to measure the diameter, length, and localization of the GA and the distance between the GA and bony cortex with the caliper function of the ultrasound machine.
Stratification of the collected data was as follows.
SMGA
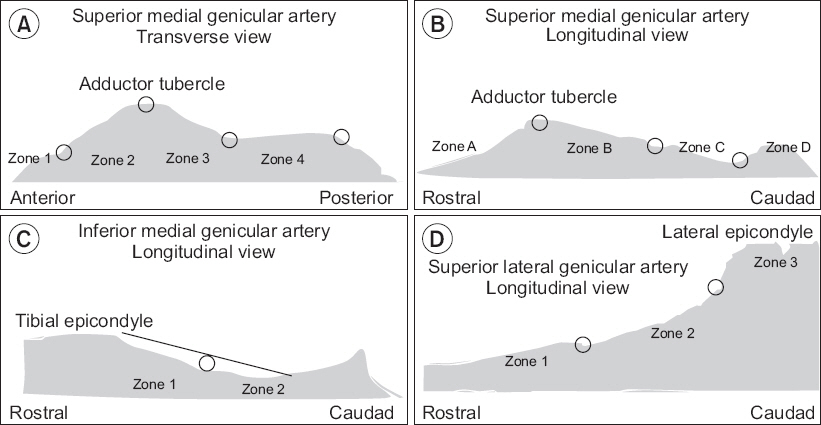
On the transverse image (Fig. 5A), points were drawn at the anterior, posterior, and middle of the adductor tubercle. The intervals between points were defined as zones. The most anterior interval was zone 1, and the most posterior interval was zone 4. On the longitudinal image (Fig. 5B), points were drawn at the peak of the adductor tubercle, at the deepest point between the tubercle and epicondyle, and at the bisection of these two points. The most rostral interval was zone A, and the most caudal interval was zone D. Each SMGA was given a position for each of the planes of the image, namely, zone 1-4, zone A-D; for example, the SMGA could be in zone 2C. If the GA was observed across two or more zones in the transverse view, the zone in which the most prominent part of the GA was distributed was noted as the corresponding localization zone. Finally, the distances between the bony cortex and SMGA in the transverse plane (dSMGAt) and in the longitudinal plane (dSMGAl) were measured.
Fig. 5
Clinical research form used for documentation of (A, B) SMGA, (C) IMGA, and (D) SLGA localization. The black line in (C) is representative of the initial fibers of the medial collateral ligament inserting on the tibia. SMGA: superior medial genicular artery. IMGA: inferior medial genicular artery. SLGA: superior lateral genicular artery.
IMGA
Longitudinal images were utilized to determine the position of the IMGA. A point was drawn at the midpoint between the peak of the tibial medial epicondyle and the initial fibers of the medial collateral ligament inserting on the tibia (Fig. 5C). The rostral interval was zone 1, and the caudal interval was zone 2. Localization of the IMGA and measurement of the distance between the bony cortex and IMGA in the longitudinal plane (dIMGAl) were performed.
SLGA
Longitudinal images were utilized to determine the position of the SLGA. Points were drawn at the distal femoral metaphysis and at the midpoint between the proximal end point of the epicondyle-shaft transition and distal femoral metaphysis (Fig. 5D). The most rostral interval was zone 1, and the distal half was zone 3. Localization of the SLGA and measurement of the distance between the bony cortex and SLGA in the longitudinal plane (dSLGNl) were performed.
Statistical analysis
A sample size of 19 was determined to have 90% power for detecting a difference of 0.5 with the null hypothesis correlation of 0.8 using a two-sided hypothesis test with a significance level of 0.05. Anticipating a 20% of drop rate, we estimated the need to recruit 24 cases. Sample size was estimated with PASS v.11 (NCSS statistical software, USA).
A descriptive analysis presented the observed data using median and mean ± standard deviation (SD) with 95% confidence interval. Spearman’s rank correlation was used for nonparametric analysis. Statistically significant differences were defined at a level of P < 0.05. Statistics were analyzed using StataMP v.14 (Stata Corp. LP, USA).
RESULTS
A total of 24 knees from 14 patients were enrolled in the present study, comprising 10 cases of bilateral knee involvement. The SMGA and SLGA were identified by ultrasound in all knees (n = 24), while the IMGA was identified in all except one knee (n = 23).
The SMGA was localized in zones 2A and 3A in 50% and 41.7% of cases, respectively (Table 1, Fig. 6). The SLGA was localized in zones 1 and 2 in 3 (12.5%) and 21 (87.5%) patients, respectively. No GA was identified in zone 3. Finally, the IMGA was localized in zones 1 and 2 in 18 (78.3%) and 5 (21.7%) patients, respectively.
Table 1
Localization of the SMGA on Ultrasound Transverse and Longitudinal Planes
| Localization on transverse plane | Localization on longitudinal plane | |
|---|---|---|
|
|
||
| Zone A | Zone B | |
| Zone 1 | 1 | 0 |
| Zone 2 | 12 | 1 |
| Zone 3 | 10 | 0 |
| Total | 23 | 1 |
Fig. 6
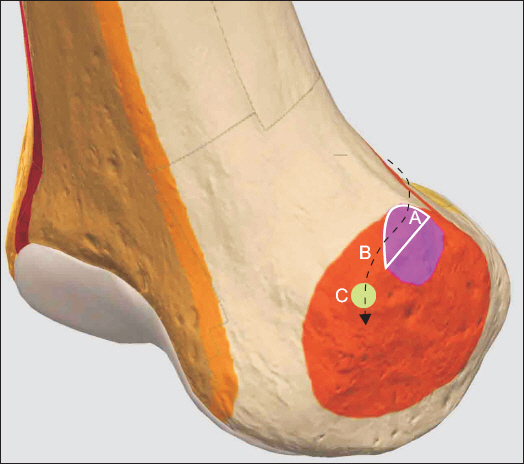
Hypothetical trajectory of the SMGA and accompanying nerve at the medial aspect of the right femoral epicondyle. 3D-drawing representative of ultrasound-guided SMGA localization. This study found that 91.7% of the SMGA was localized to the upper part of the adductor tubercle. It is hypothesized that the SMGA passes around the upper part of the adductor tubercle before descending to the target point for the SMGN (C: green colored circle) located 1 cm anterior to the peak of the adductor tubercle, as described by Yasar et al. [9]. A: white solid line encircled area, white solid line shows the boundary of the area corresponding to the upper part of the adductor tubercle. B: black dotted line, course of the SMGA. Pink colored area: adductor tubercle, right. Orange colored area: epicondyle, medial femoral, right. SMGA: superior medial genicular artery. SMGN: superior medial genicular nerve.
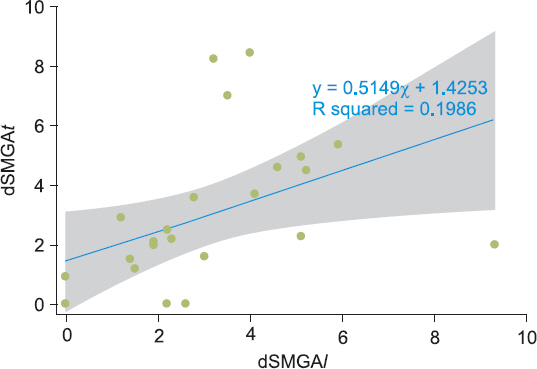
A dot plot of the distance from a given GA to the corresponding bony cortex is shown in Fig. 7. The distance from bony cortex to SMGA in the transverse plane (dSMGAt) ranged from 1.9 to 4.0 mm with a 95% confidence interval of 2.99 ± 2.48 mm (n = 24). The distance from bony cortex to SMGA in the longitudinal plane (dSMGAl) ranged from 2.1 to 3.9 mm with a 95% confidence interval of 3.04 ± 2.15 mm (n = 24). A scatter plot depicting the relationship between dSMGAt and dSMGAl is shown in Fig. 8. Spearman’s correlation coefficient (rs) between the dSMGAt and dSMGAl was 0.6539, and the P value of the statistical hypothesis was 0.0005, indicating that we could reject the null hypothesis that dSMGAt and dSMGAl are independent of each another and instead appeared to be directly correlated.
Fig. 7
Dot plot of the distance from the GAs to the corresponding bony cortex. dSMGAt: distance from the bony cortex to SMGA in the transverse plane. dSMGAl: distance from the bony cortex to SMGA in the longitudinal plane. dIMGAl: distance from the bony cortex to IMGA in the longitudinal plane. dSLGAl: distance from the bony cortex to SLGA in the longitudinal plane. SMGA: superior medial genicular artery. IMGA: inferior medial genicular artery. SLGA: superior lateral genicular artery.
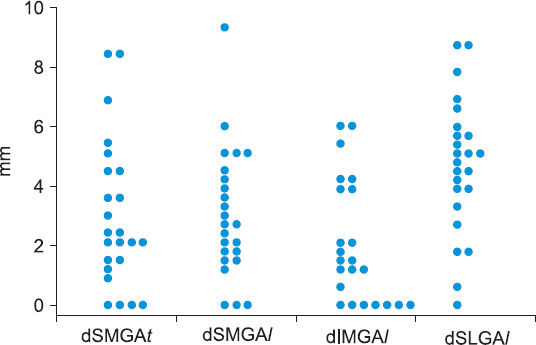
Fig. 8
Scatter plot showing the relationship between dSMGAt and dSMGAl. Blue straight line: fitted values, shaded area: 95% confidence interval. dSMGAt: distance from the bony cortex to SMGA in the transverse plan. dSMGAl: distance from the bony cortex to SMGA in the longitudinal plane. SMGA: superior medial genicular artery.
The distance from bony cortex to SLGA in the longitudinal plane (dSLGAl) ranged from 3.8 to 5.7 mm with a 95% confidence interval of 4.73 ± 2.27 mm (n = 24). The distance from bony cortex to IMGA in the longitudinal plane (dIMGAl) ranged from 1.1 to 2.9 mm with a 95% confidence interval of 2.02 ± 2.04 mm (n = 23).
The median (p50) of the distance from bony cortex to GA at the transverse plane for the SMGA, longitudinal plane for the SMGA, longitudinal plane for the SLGA, and longitudinal plane for the IMGA were 2.25 (range, 0-8.5, n = 24), 2.7 (range, 0-9.3, n = 24), 4.95 (range, 0-8.7, n = 24), and 1.5 (range, 0-6.0, n = 23), respectively.
DISCUSSION
The first objective of this study was to ascertain whether there was a correlation between dSMGAt and dSMGAl. When the same GA is observed on ultrasound transverse and longitudinal views, dSMGAt and dSMGAl would be same. In this study, 16 knees (66.7%) fell into the 95% confidence interval, and the two parameters (dSMGAt and dSMGAl) were determined to not be independent (Fig. 8). Although these two parameters were significantly correlated, the β1 (dSMGAl coefficient) of the change in dSMGAt that occurs when the dSMGAl changes by one unit was 0.5149 (Fig. 8), suggesting that GA scanning using an X-Y axis system is valid, at least weakly so. Different pressure applied on the probe or observation of different vessels in each view could explain the eight knees that were excluded from the shaded area in Fig. 8. According to sonographic images from several case reports and case series of sono-guided GN RF or cooled RF, the distances between GA and bony cortex do not show a consistent pattern. Thus, we tried to evaluate the 95% confidence interval of this distance and the relationship between the two parameters. The combined sex GA dimensions in previous studies were estimated as follows: SMGA: 1.4 (0.5-2.2) mm; SLGA: 1.6 (1.0-2.3) mm; and IMGA: 1.5 (0.6-3.0) mm at the lateral aspect of the femur and tibia according to one cadaveric study [16]. Based on these data, we defined the GA as a sectional pattern diameter of 1.2 mm in longitudinal view and a length longer than 2.5 mm in transverse view.
The second objective of this study was to estimate localization of the GA in 24 knees. The SMGA was localized in zones 2A and 3A in 50% and 41.7% of cases, respectively. Zones 2A and 3A correspond to the upper part of the adductor tubercle. This means that the SMGA was mainly localized in the upper half of the adductor tubercle. Consistent with these data, Yasar et al. [9] investigated anatomic landmarks of the SMGN branches in a cadaveric model and showed that the bony cortex 1 cm anterior to the peak of the adductor tubercle is a target point for SMGN injection [9] (Fig. 6). It might be hypothesized that the reported anatomic structures consisting of “the bony cortex 1 cm anterior to the peak of the adductor tubercle [9]” and “the upper part of the adductor tubercle” described in our study are present along the same trajectory of the SMGA and accompanying nerve (Fig. 6). The present finding supports the feasibility of ultrasound-guided SMGN block using the upper part of the adductor tubercle as the anatomic landmark (Fig. 6). However, cadaveric studies detailing the SLGN and IMGN are scarce. In this study, about 80% of SLGAs and IMGAs were localized at the distal and proximal portions of the epicondyle-shaft transition, respectively. It is expected that this finding will be useful for SLGN and IMGN block under ultrasound guidance.
The GAs, the scanning targets used in this study under ultrasound guidance, are small direct arterial terminations at the knee. As the aim of this study was to estimate the localization of GAs at the level of the epicondyle-shaft junction, discerning the crucial blood suppliers to the GAs is important, as ultrasound tracing from the descending genicular artery (DGA) distally to the epicondyle-shaft level for the validity of GA scanning could be assured by discerning crucial blood supply. Specifically, the crucial blood suppliers to the arterial network around the knee are the posterior anastomosis and medial anastomosis.
With respect to arterial supply in the knee, many anatomical textbooks and atlases provide different descriptions and lack detail [10-12]. Nevertheless, it has been broadly assumed that the femoral, popliteal, and anterior tibial arteries form an arterial network surrounding the knee joint, which together give rise to the SMGA, SLGA, IMGA, and ILGA [13]. In support of this assumption, the posterior anastomosis to the GA, the origin of which is the popliteal artery, exhibits a large direct termination at the knee [10-13]. However, Sung-Yoon et al. [14] claimed a role for a medial anastomosis via the DGA, asserting that the small arterial direct termination at the adductor tubercle is from the medial anastomosis to the SMGA via DGA rather than to the SMGA from the posterior anastomosis [17]. Thus, although the posterior anastomosis is a crucial blood supplier to the medial anastomosis, the medial anastomosis does seem to directly terminate at the knee.
This study was not designed to provide strong evidence regarding the localization of GN, and the validity of GA localization using X-Y axis structure remains weak (Fig. 8). Thus, there is a need for further studies tracing from the DGA distally to the epicondyle with diagnostic block evaluation, as well as evaluation of the relevance of applying the X-Y axis structure for GA localization. Consequently, details of the limitations of our study are as follows.
1) The path of DGA in the lateral thigh is unpredictable [18], and it has at least 5 origins. Therefore, its anastomosis at the knee to the genicular artery is both inconsistent and often inadequate [19]. The present study scanned the GA directly at the epicondyle. However, compared to tracing the DGA distally to the epicondylar level, this scanning technique allowed for increased opportunity to obtain less objective GA scanning.
2) As GAs travel with nerves in a neurovascular bundle [2], it is likely that the GNs may also exhibit a number of anatomical variations around the knee, although cadaveric studies are lacking. This study could not exclude the possibility that the GNs were in separate locations even though they were localized with GAs on ultrasound. However, 2 ml of 0.5% ropivacaine was injected into 3 knees at each location and evaluated according to a previously described method [2]. Patients who underwent this procedure reported significant improvement in pain (VAS of 2/10 with activity and 0/10 at rest), suggesting that a diagnostic block with local anesthetics might overcome non-contiguity between GNs and GAs.
3) This study assumed that GAs and accompanying GNs would be seen as linear on transverse view and sectional on longitudinal view with ultrasound scanning, based on the anatomy of the posterior anastomosis. However, there was no basis for explicitly stating that the GA and GN exist together in the X-Y axis structure on axial and coronal planes, respectively. Moreover, the medial anastomosis concerned with the small direct arterial termination from the DGA via the deep articular branch does not support use of the X-Y axis structure. Therefore, tracing from the DGA distally to the deep articular branches should be performed in follow up studies to overcome the limitation of GA scanning directly at the epicondyle.
4) In this study, ultrasound images of GAs were achieved and categorized by arbitrarily defined zones with no anatomical basis. Rather, it is ambiguous to define the border of adductor tubercle and the transition point at the epicondyle shaft junction. This study posits that such an anatomically defined zone might be useful until a consensus on the anatomically defined zone under ultrasonography is reached.
In conclusion, it was found that the SMGA was mainly localized to the upper part of the adductor tubercle. In addition, the SLGA and IMGA were mainly localized at the distal portion and proximal aspects of the epicondyle-shaft transition, respectively. Taken together, the results of this study support the feasibility of ultrasound guidance for GN localization in patients with knee osteoarthritis. There continues to be a need for further tracing studies from a proximal origin, with diagnostic block evaluation, using validated transducer placement.
ORCID
Kyoung Hee Han: https://orcid.org/0000-0003-4698-3535
Sung Ryul Yoon: https://orcid.org/0000-0001-8355-7530
Yoo Jin Choung: https://orcid.org/0000-0002-4478-4332
Hyun Young Lim: https://orcid.org/0000-0003-0343-6750


