


INTRODUCTION
Point-of-care (POC) arterial blood gas analysis (ABGA) allows simple and quick testing for the appropriateness of ventilation, the measurements of electrolytes and the level of hemoglobin (Hb)/hematocrit (Hct). It is also used as a guideline for transfusion in cases of blood loss during surgeries [1]. However, POC ABGA measures Hb using conductivity, and thus generates different results from measurements utilizing optical methods that are performed in laboratories. A number of studies have reported that hemodilution, cardiopulmonary bypass, and severe hypoalbuminemia influence the Hb test results of conductivity-based POC ABGA [2-4]. In fact, the authors of this study compared the Hb/Hct measurements generated by ABGA in the operating room and those measured in the laboratory and found that ABGA performed in an operating room tends to result in lower values. If such a tendency is true, the misleading results could lead to unnecessary transfusions during operations [4].
The aim of this study was to collect and analyze Hb data simultaneously measured via POC ABGA in the operating room and in the laboratory to compare the results obtained via two methods for any differences. Furthermore, if there were differences, this study sought to identify measures to reduce such differences.
MATERIALS AND METHODS
This study was a retrospective study and was conducted following approval from the Institutional Review Board of our Hospital (IRB no. 2016-01-021). We collected test results from patients who underwent surgery between 2015 and 2016. Table 1 shows patients characteristics and data at the time of sampling. We performed arterial blood gas analysis (ABGA) and collected complete blood count (CBC) samples from the radial or dorsalis pedis artery to determine Hb/Hct and platelet count in patients who underwent surgery and experienced blood loss of more than 500 ml. The first 10 ml of blood drawn from the vessel was discarded to exclude dilution. Following collection, samples were obtained and divided into CBC tubes (BD Vacutainer®, Becton Dickinson, USA) and ABGA syringes (BD Preset™, Becton Dickinson, UK), as directed by each manufacturer. The test results comprised Hb/Hct results measured by the Sysmex XE-2100 hematology analyzer (Sysmex Corporation, Japan) in the laboratory and those measured by the GEM Premier 3500 blood gas analyzer (Instrumentation Laboratory, USA) as per POC ABGA in the operating room. Both the Sysmex XE-2100 and the GEM Premier 3500 underwent periodic quality controls (every 6 months and every 3 weeks).
Table 1
Demographic Data, Data at the Time of Hemoglobin Analysis
Statistical analysis
The Hb value measured by the Sysmex XE-2100 was set as the gold standard and was compared with that measured by the GEM Premier 3500 as per the POC AGBA. The mean bias, standard deviation (SD), 95% confidence interval (95% CI), and standard error of the difference of results obtained via the two methods were computed, and Bland-Altman analysis was performed. Evaluation of the clinical significance of the results obtained by Bland-Altman analysis was performed through calculation of the percentage error (%) based on Critchley and Critchley’s formula [5], which doubles the SD of the difference between the two measurements and divides this value by the mean value of the two measurements, as follows:
The results of the two methods were considered to be equivalent when the percentage error was < 30% [5].
The limit of agreement was calculated by: mean Hb bias ± 1.96 × SD. The null hypothesis was set to the difference of the two results being 0. We conducted a one-sample t-test to determine whether the actual difference of results was significantly different from 0. A 95% CI was chosen and the null hypothesis was to be rejected when P < 0.05, which would indicate that the two values were significantly different.
The clinical utility of the POC AGBA device was tested by indication or contraindication of the transfusion requirement using error grid analysis. Zone A should contain 95% of all measurements and indicates a difference that is clinically acceptable without affecting the transfusion indication. Zone B is defined as the area of significant errors (optimally less than 5% of all measurements), which is the area between zone A and zone C. Finally, zone C is defined as the area of major therapeutic errors [6]. The 95% CI for each zone was calculated using the Clopper-Pearson exact method [7].
In addition, linear regression analysis was performed to determine the relationship between the Hb measurement performed via POC ABGA and that performed in the laboratory. The Hb value obtained via POC ABGA was adjusted as per the regression equation (adjusted Hb), and the agreement between the adjusted Hb and the Hb value obtained in the laboratory was evaluated. All the statistical analyses were performed using Medcalc software package, version 16.1.2 (MedCalc Software, Belgium) for Windows®.
RESULTS
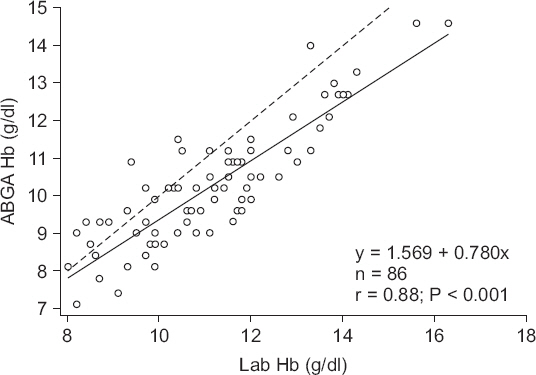
We collected a total of 86 samples via a chart review. Figs. 1 and 2 show the results of Bland-Altman analysis and error grid analysis that provides the difference between the Hb values measured via GEM Premier 3500 and those measured via Sysmex XE-2100. Fig. 1 shows the difference in the absolute values of the two measurements; the two values had a bias of −0.9 g/dl (P < 0.001, 95% CI, −1.038 to −0.665), upper agreement limit of 0.9 g/dl, lower agreement limit of −2.6 g/dl. The correlation coefficient (r) between the two values was 0.88 (P < 0.001), and the percentage error was 16.4%. According to error grid analysis, zones A, B, and C encompassed 89.5% (95% CI, 81.1%-95.1%), 10.5% (95% CI, 4.9%-18.9%) and 0% (95% CI, 0%-4.2%), respectively, of data pairs (Fig. 2). Fig. 3 illustrates the linear regression analysis of the gold standard Hb and ABGA Hb values with the following regression equation, as follows:
y = 1.569 + 0.780x (x: Laboratory measured Hb; y: ABGA measured Hb).
Fig. 1
Bland-Altman plot of difference between ABGA measured hemoglobin and laboratory measured hemoglobin. Solid line: bias = −0.9 g/dl, Dashed lines: the upper and lower limits of agreement (1.96 times the SD). ABGA Hb: arterial blood gas analysis measured hemoglobin, Lab Hb: laboratory measured hemoglobin, SD: standard deviation.

Fig. 2
Paired hemoglobin values provided by laboratory measured hemoglobin and ABGA measured hemoglobin plotted using three zones error grid. Zone A represents the area of clinical acceptable difference, zone B represents the area of significant errors, although their magnitude is not as significant as in zone C which represents the area of major therapeutic errors leading to unnecessary or delayed transfusion. Zone A, B and C encompassed 89.5% (95% confidence interval [CI], 81.1%-95.1%), 10.5% (95% CI, 4.9%-18.9%) and 0% (95% CI, 0%-4.2%) of data pairs. ABGA Hb: arterial blood gas analysis measured hemoglobin, Lab Hb: laboratory measured hemoglobin.

Fig. 3
Scatter plot of the laboratory measured hemoglobin and ABGA measured hemoglobin. Solid line: linear regression graph, Dashed line: y = x. ABGA Hb: arterial blood gas analysis measured hemoglobin, Lab Hb: laboratory measured hemoglobin.
The ABGA Hb value was adjusted using this equation. We subtracted 1.569 from the ABGA Hb and divided it by 0.780 to obtain the adjusted Hb value. Figs. 4 and 5 show the difference in the adjusted Hb values and the gold standard Hb as shown via the Bland-Altman analysis and error grid analysis. Fig. 4 shows the difference in the absolute values of the two measurements with a bias of 0 g/dl (P = 0.991), upper agreement limit of 1.9 g/dl, lower agreement limit of −1.9 g/dl. The correlation coefficient (r) between the two values was 0.88 (P < 0.001), with a percentage error of 18.2%. Fig. 5 shows the three-zone error grid; zones A, B, and C encompassed 91.9% (95% CI, 83.9%-96.7%), 8.1% (95% CI, 3.3%-16.1%) and 0% (95% CI, 0%-4.2%), respectively, of data pairs. Table 2 summarizes the absolute value of the difference between laboratory measured Hb and ABGA POC measured Hb or adjusted Hb. The percentage of the calculated difference within 1.0 g/dl between laboratory Hb and ABGA Hb was 51.2%, and after adjusted regression, the percentage of the difference within 1.0 g/dl between laboratory Hb and adjusted Hb was 72.1%.
Fig. 4
Bland-Altman plot of difference between adjusted hemoglobin and laboratory measured hemoglobin. Solid line: bias = 0 g/dl, Dashed line: the upper and lower limits of agreement (1.96 times the SD). Adjusted Hb: hemoglobin adjusted by linear regression graph, Lab Hb: laboratory measured hemoglobin, SD: standard deviation.
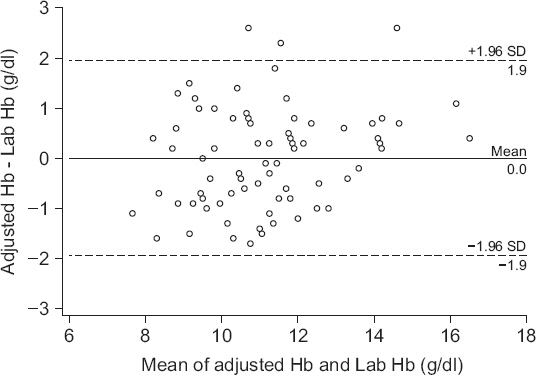
Fig. 5
Paired hemoglobin values provided by laboratory hemoglobin and adjusted hemoglobin plotted using three zones error grid. Zone A, B and C encompassed 91.9% (95% confidence interval [CI], 83.9%-96.7%), 8.1% (95% CI, 3.3%-16.1%) and 0% (95% CI, 0%-4.2%) of data pairs. Adjusted Hb: hemoglobin adjusted by linear regression graph, Lab Hb: laboratory measured hemoglobin.
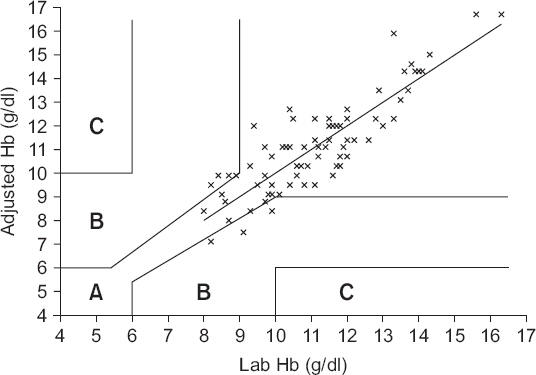
Table 2
Absolute Values of the Difference between Laboratory Measured Hemoglobin and ABGA Measured Hemoglobin or Adjusted Hemoglobin
| Difference from Lab Hb value | Lab Hb-ABGA Hb | Lab Hb-Adjusted Hb |
|---|---|---|
| < 1.0 g/dl | 44 (51.2) | 62 (72.1) |
| > 1.0 g/dl | 42 (48.8) | 24 (27.9) |
Values are presented as number (%). Lab Hb: laboratory measured hemoglobin, ABGA Hb: arterial blood gas analysis measured hemoglobin, Adjusted Hb: hemoglobin adjusted by linear regression. Regression equation between laboratory measured Hb and ABGA measured Hb: y = 1.569 + 0.780x (x: Laboratory measured Hb; y: ABGA measured Hb). Adjusted Hb = (ABGA Hb − 1.569) / 0.780.
DISCUSSION
The result of the Bland-Altman analysis between the laboratory Hb and ABGA Hb values showed that the mean bias was −0.9 g/dl with a percentage error of 16.4%, indicating a significant difference between the two values. However, a Bland-Altman analysis comparing the adjusted Hb value that was obtained via a linear regression analysis and the laboratory Hb value showed that there was no significant difference between these two values. The percentage error after adjustment was 18.2%. The reliability of the transfusion decision was assessed using the three-zone error grid. According to Morey et al. [6], zone B should encompass less than 5% of data pairs. However, 10.5% of original data pairs and 8.1% of adjusted data pairs were included in zone B in the present study. Thus, the use of adjusted Hb values instead of ABGA Hb values is questionable.
The Sysmex XE-2100, which is used for Hb/Hct testing in laboratories, uses a sulfolyser to denature Hb, converts it into sodium lauryl sulfate hemoglobin by structurally changing the globin and oxidizing the heme, and measures the absorbance. For this test, 3 ml of blood must be injected into the ethylenediaminetetraacetic acid test tube, and the entire test takes about 30 minutes. The GEM Premier 3500, which is used for POC ABGA in operating rooms, measures Hct by its conductivity; a small amount of a whole blood sample (135 μl) is tested via aspiration within the disposable cartridge that comprises testing reagent and minimized sensor, and the entire test takes about 85 seconds, which is a shorter length of time than the laboratory test [8]. The Hb/Hct is measured via the following principle: when a low-frequency current is incurred on the blood sample, the non-conductive cell membranes of red blood cells cannot conduct the current, meaning that a higher number of red blood cells results in a lower conductivity; such difference in conductivities is used to measure the Hb/Hct [2,9]. Again, the entire test requires only a few minutes, which makes POC ABGA useful in situations where simple and quick testing is demanded, such as for patients during a surgery [10].
In most surgeries, crystalloid solutions are usually infused before the induction of anesthesia to prevent any anesthesia-induced hypotension, which results in hemodilution [11]. When such crystalloid solutions, which are abundant with electrolytes, lead to hemodilution, the Hb/Hct measurements that are taken by conductivity-based POC ABGA can be lower than the usual values; the difference in values tends to increase with lower Hct levels [4,10,11]. The Hb/Hct measurements are lower than the gold standard values obtained via optical methods because an increased concentration of electrolytes increases plasma conductivity [1,2]. As predicted, the Hb measurements taken with the GEM Premier 3500 in this study were also lower than the Hb values obtained with the Sysmex XE-2100 (difference of values: −0.9 g/dl). This comparison revealed that conductivity-based POC testing methods for patients with hemodilution induced by crystalloid solutions show a downward bias compared to measurements taken via optical methods.
Unlike crystalloid solutions, colloid solutions tend to induce an upward bias in the Hb/Hct measurements performed via POC ABGA compared to those performed in the laboratory [2]. This is because administration of colloid solutions during a conductivity-based POC ABGA reduces plasma conductivity, which reduces the overall blood conductivity, leading to increased Hct measurements. Furthermore, the high viscosity of colloid solutions is also known to increase Hct measurements obtained by POC ABGA [1,2].
Our adjustment method using a regression equation can be easily adapted to the GEM Premier 3500, decreasing downward bias in data pairs in zone B. Furthermore, the percentage of the calculated difference within 1.0 g/dl between laboratory Hb and ABGA Hb was 51.2%; however, after adjusted regression, the percentage of the difference within 1.0 g/dl between laboratory Hb and adjusted Hb increased to 72.1%.
This study was conducted via a retrospective chart review and is bound to have some limitations. The composition of the patient sample was not considered, and variables such as the types of surgery, types and doses of administered fluids, injection of albumin, and transfusion were not controlled. Nevertheless, the authors of this study postulated that the employed method was valid for the objective of the current study, which was to verify whether Hb/Hct measurements obtained by POC ABGA could be used as an appropriate transfusion guideline in general operating rooms regardless of the type of surgery being performed as well as in specific surgical situations. At a minimum, our findings suggest that interpretation of Hb/Hct values obtained via POC ABGA in the operating room as a transfusion guideline should be undertaken with caution.
When we adjusted the ABGA results via a linear regression analysis, we found that the percentage of error of the adjusted Hb (18.2%) was 1.8% greater than the value before adjustment (16.4%). Both values had a percentage error of less than 30%, which signifies agreement with the Hb values obtained in the laboratory; however, because the percentage error actually increased after adjustment of the value, a search for other methods to adjust Hb values may be necessary.
In conclusion, Hb measurements obtained with reference to conductivity via a POC ABGA were significantly lower than those obtained via optical methods in laboratories. Hence, caution should be used in interpreting the conductivity-based POC ABGA results as a transfusion guide, in order to prevent unnecessary transfusions. In addition, although the downward bias of the Hb measurements obtained via POC ABGA was adjusted using a regression equation, the percentage error of the adjusted value actually increased; thus, there should be more discussions on the appropriate method of adjustment and the need for adjustment. We also expect the development of a POC ABGA device capable of reflecting the downward bias of POC ABGA Hb values to obtain more accurate Hb values.


