Transient decrease in B-type natriuretic peptide level after liver transplantation does not ensure favorable post-transplant 30-day outcomes
Article information

Abstract
Background
High B-type natriuretic peptide (BNP) levels within the first 3 postoperative days (postBNPPOD3) after liver transplantation (LT) are greatly predictive of the 30-day mortality. We evaluated clinical impact of transient decrease in postBNPPOD3 compared to pretransplant BNP (preBNP) level on mortality and major adverse cardiac event (MACE) within 30 days after LT.
Methods
We retrospectively evaluated 3,811 LT patients who measured delta BNP (deltaBNP), defined by serial postBNPPOD3 minus preBNP. Thirty-day all-cause mortality and MACE were estimated in patients with deltaBNP < 0 (n = 594, 15.6%) and > 0 (n = 3,217, 84.4%), respectively. Kaplan-Meier survival and multivariable Cox regression analysis were used.
Results
Within 30 days, 100 (2.6%) of all patients died. Unexpectedly, 30-day mortality rate (6.1% [95% CI: 4.2–8.4%] vs. 2.0% [95% CI: 1.5– 2.5%], P < 0.001) and MACE (24.2% [95% CI: 20.4–28.5%] vs. 15.3% [95% CI: 14.0– 16.7%], P < 0.001) were higher in patients with deltaBNP < 0 compared to those with deltaBNP > 0, respectively. Patients with deltaBNP < 0 had higher preBNP level (median [interquartile range], 251 [118, 586] vs. 43 [21, 92] pg/ml, P < 0.001) and model for end-stage liver disease score (26 [14, 37] vs. 14 [9, 23], P < 0.001) and more transfused intraoperatively. DeltaBNP < 0 remained significant after adjustments for potential confounders in multivariable analysis of 30-day mortality and MACE.
Conclusions
DeltaBNP < 0 within the first 3 postoperative days is mainly attributed to pre-LT severe liver and cardiac disease status, therefore, transient decrease in BNP level after LT does not ensure favorable post-LT 30-day outcomes.
INTRODUCTION
Because of high early and late cardiovascular death after liver transplantation (LT) in the modern era, identification of vulnerable heart and severity of cardiac disease are crucial in patients with end-stage liver disease (ESLD) undergoing LT [1-3]. Recent studies demonstrated the routine monitoring of peri-LT B-type natriuretic peptide (BNP) provides risk stratification for early mortality as a practical and useful biomarker in LT [4]. Specifically, high peak BNP levels > 400 pg/ml within the first 3 postoperative days (postBNPPOD3) after LT are highly prevalent in advanced liver disease and are considered as highly vulnerable to become acute heart failure (HF) or “HF likely” status shortly after LT [4,5].
In this regard, physicians may suppose improved cardiac status with expecting favorable post-LT outcomes if there are decreases in postBNPPOD3 compared to pre-LT BNP (preBNP) level immediately after LT. However, it is unclear whether preBNP is initially higher from the beginning before LT than postBNPPOD3 in this clinical situation.
In this study, we evaluated clinical impact of transient decrease in postBNPPOD3 compared to preBNP level on 30-day mortality and major adverse cardiac event (MACE) within 30 days after LT, after adjusting with revised cardiac risk index (RCRI), the most frequently validated model for perioperative cardiac risk stratification [6].
MATERIALS AND METHODS
Patients and data collection
A total of 3,811 consecutive, prospectively registered patients who underwent living-donor LT or deceased-donor LT from 2010 to 2020 were enrolled after excluding patients with less than 18 years old, re-transplantation, history of open-heart surgery, and incomplete data without measuring serial preBNP and postBNPPOD3.
Patient demographics, medical history, model for end-stage liver disease score (MELDs), and laboratory and intraoperative variables were obtained automatically using a fully computerized data extraction software (ABLE). Mortality data were extracted from patients’ electronic medical records and the updated record of the institution’s LT registry. This study was approved from the Institutional Review Boards of Asan Medical Center (protocol number: 2022-0436).
BNP measurement
Serial BNP levels were measured pre- and post-operatively (the ADVIA Centaur CP Immunoassay System) as a part of our institution’s routine cardiac workup since 2008 regardless of the symptoms or signs of acute or chronic HF. BNP levels measured more than once within 3 postoperative days after LT and their peak value (postBNPPOD3) was chosen for the analysis, and those who did not measure either preBNP or postBNPPOD3 were excluded.
PreBNP was selected with the most proximate to the date of LT within 7 pre-LT days, when multiple measurements were done preoperatively.
Delta BNP (deltaBNP) was defined as the difference with serial preBNP and postBNPPOD3 (deltaBNP = postBNPPOD3 – preBNP).
RCRI and post-reperfusion syndrome (PRS)
The traditional RCRI was evaluated for the multivariable analysis. The RCRI is the most frequently validated model for perioperative cardiac risk stratification and is recommended by many guideline committees [6]. Scoring system and variables included in the RCRI are as follows (worth 1 point each): history of ischemic heart disease, congestive heart failure, cerebrovascular disease, high-risk surgery (i.e., liver transplant), preoperative insulin use, and preoperative creatinine level > 2 mg/dl.
PRS was defined as a severe hemodynamic perturbation more than 1 min within the first 5 min after graft reperfusion during LT [2].
Outcomes
The primary endpoint was 30-day all- cause mortality rate after LT and MACE. MACE was defined as the composite of postoperative cardiovascular mortality, atrial fibrillation, ventricular arrhythmias, ST-T wave changes with chest tightness, myocardial infarction, pulmonary embolism, and stroke within 30 days after LT.
Statistics
Data were expressed as mean ± standard deviation or median (interquartile range) for continuous variables, and number (percentage) for categorical variables. In univariate statistical comparisons for the patients with deltaBNP > 0 and < 0, the chi-square test or Fisher’s exact test was used for categorical variables, Student’s t-test and Mann-Whitney test for continuous variables, as appropriate. The Kaplan-Meier survival curve was used to depict the risk of within 30 days all-cause mortality.
To evaluate the relationship between clinical, biochemical parameters, liver disease severity, cardiac risk index and mortality events, multivariate or a Cox proportional multiple regression model was built. With MACE as outcome, multivariable logistic regression model was performed. To obtain adjusted hazard ratios (HR) for mortality or odds ratio for MACE from a multivariable or a Cox regression model, covariates included were age, sex, RCRI, MELD score, intraoperative red blood cell (RBC) transfusion amount, PRS and patients with deltaBNP < 0, respectively. The proportional hazards assumption of deltaBNP can was checked using scaled Schoenfeld residuals (P = 0.430). Statistical analyses were conducted in R (Version 4.1.2, R Foundation for Statistical Computing), with packages of ‘moonBook [7]’, autoReg [8]”, “survminer [9]” “survival [10]” and a two-sided significance level of 0.05.
RESULTS
Of 3,811 LT recipients included, their age was median 54 (48, 59) years and men were 2,769 (72.7%). The MELDs were median 15 (10, 26) and total bilirubin was median 2.2 (1.0, 10.5) mg/dl. The primary causes of liver disease were hepatitis B or C virus-related liver cirrhosis (60.9%), alcoholic liver disease (24.7%) and others (14.4%) (Table 1). Prevalence of RCRI category 1, 2, and 3 were 66.2%, 26.5%, and 7.3%, respectively (Table 1)

Descriptive Statistics Between DeltaBNP > 0 and DeltaBNP < 0
Characteristics in patients with deltaBNP < 0
Patients with deltaBNP < 0 had higher MELD score compared to those with deltaBNP > 0 (26 [14, 37] vs. 14 [9, 23], P < 0.001). They also showed higher risk of RCRI preoperatively and suffered from more transfusion intraoperatively. However, the rate of intraoperative postreperfusion syndrome were similar (Table 1). Fig. 1 shows individual changes in BNP, demonstrating that patients with deltaBNP < 0 (n=594, 15.6%) had higher preBNP level compared to those with deltaBNP > 0 (251 [118, 586] vs. 43 [21, 92] pg/ml, P < 0.001).
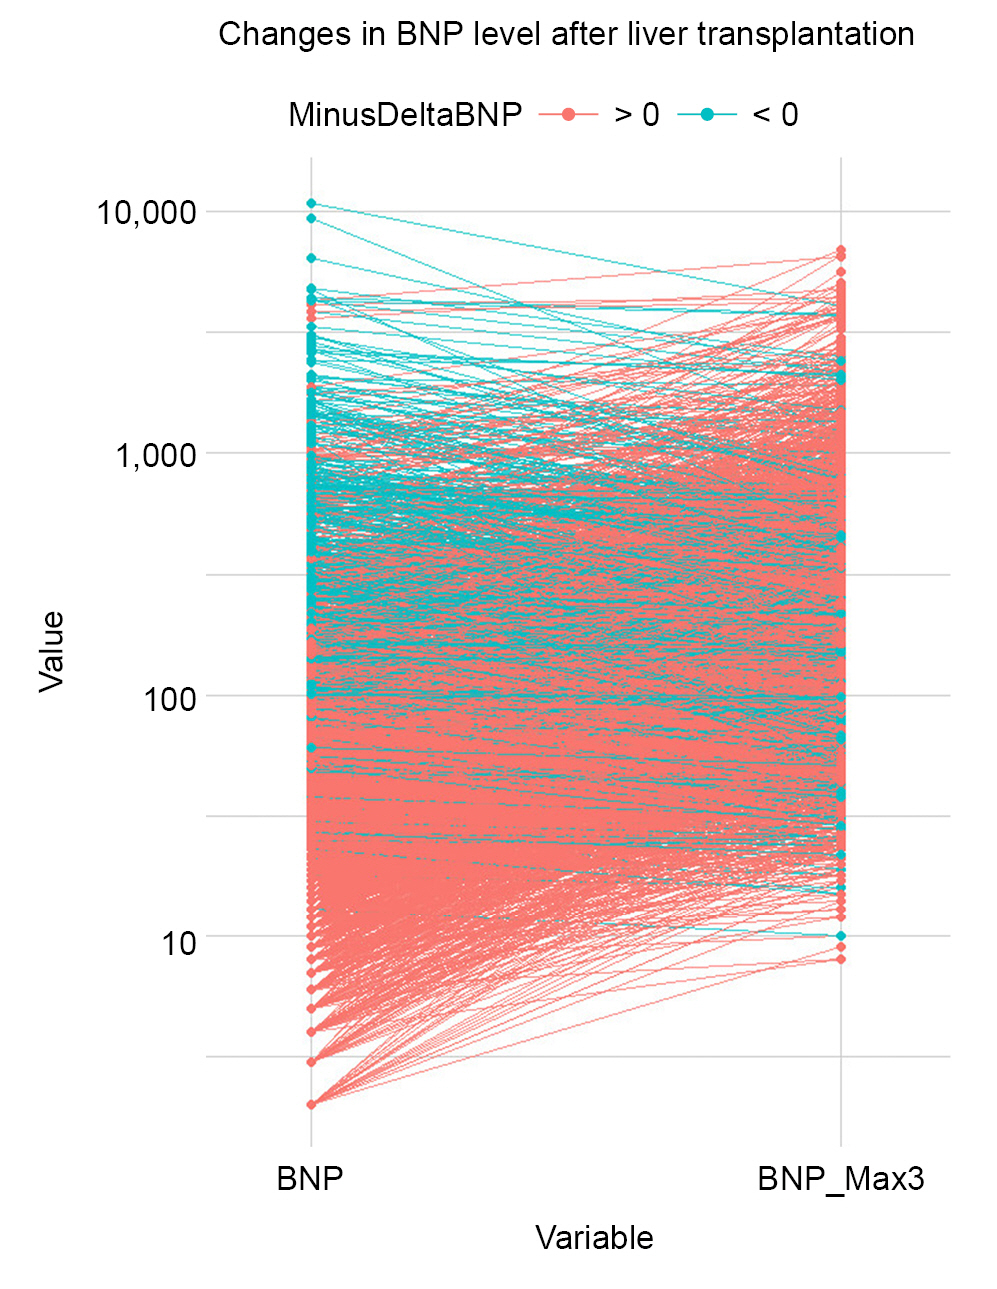
Line plots depicting individual value preoperative B-type natriuretic peptide (BNP) and BNP_Max3 liver transplantation. Line shows the change of preoperative BNP value to the BNP_Max3. BNP: B-type natriuretic peptide, BNP_Max3: high BNP levels within the first 3 postoperative days, DeltaBNP: difference between BNP_Max3 and preoperative BNP.
Thirty-day mortality and MACE
Within 30 days, 100 (2.6%) of all patients died. However, unexpectedly, 30-day mortality rate (6.1% [95% confidence interval, 95% CI: 4.2–8.4%] vs. 2.0% [95% CI: 1.5–2.5%], P < 0.001) and MACE (24.2% [20.4–28.5%] vs. 15.3% [14.0–16.7%], P < 0.001) were higher in patients with deltaBNP < 0 compared to those with deltaBNP > 0, respectively (Table 1). Fig. 2 shows the Kaplan-Meier survival curve of the risk of within 30 days all-cause mortality.
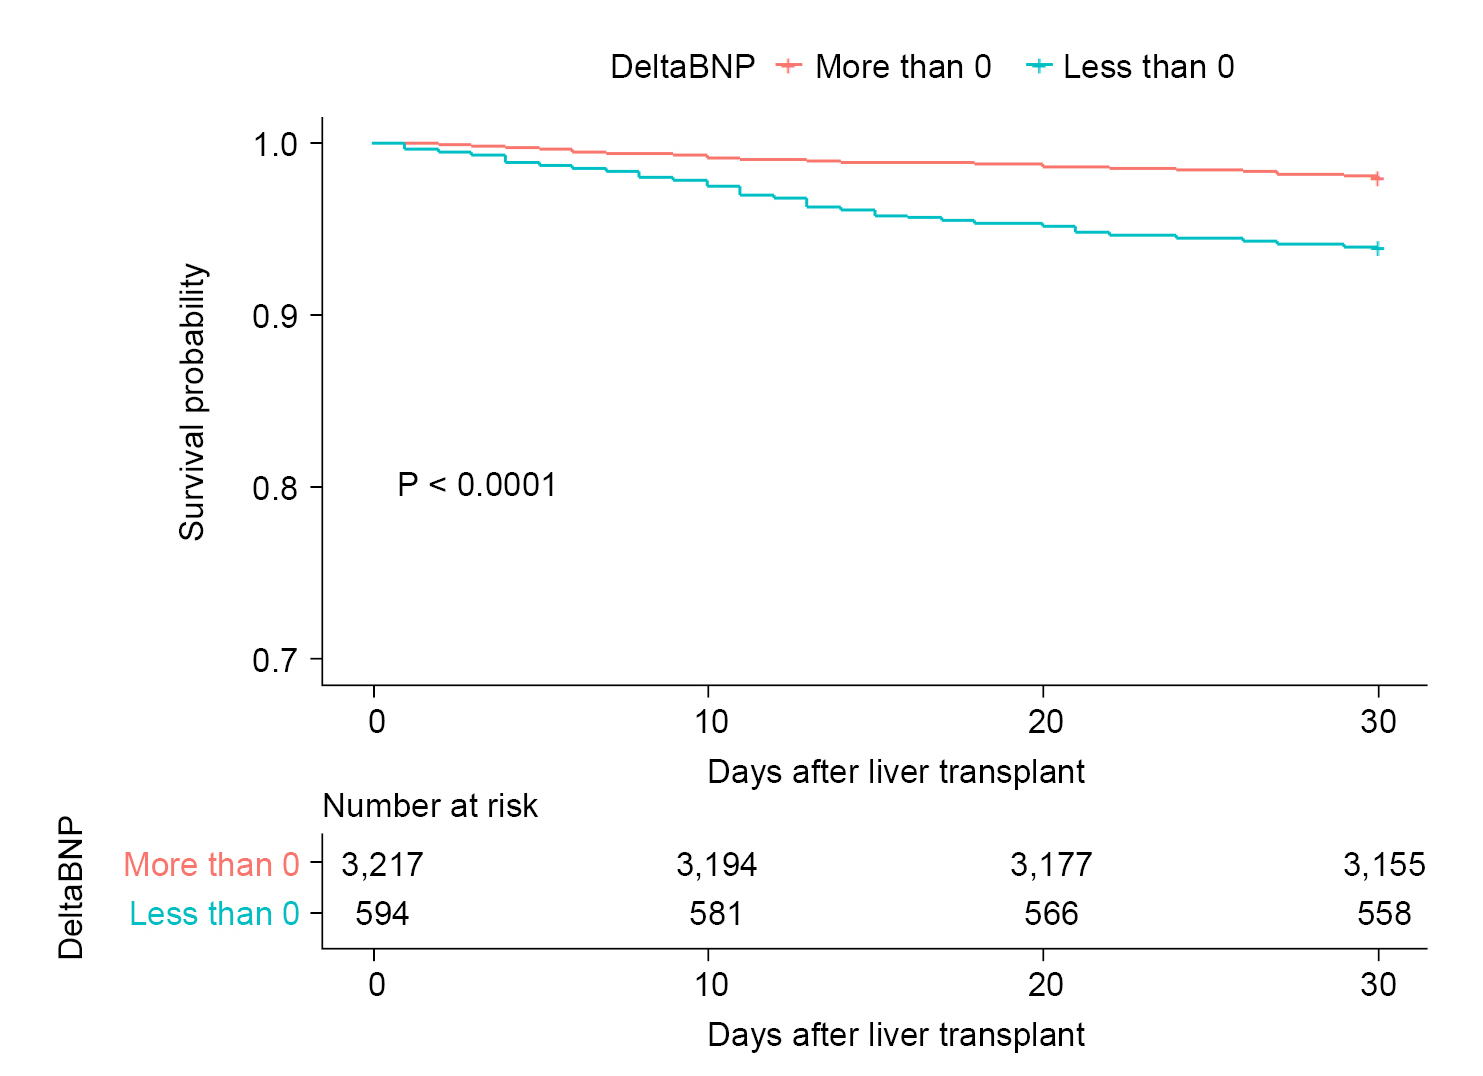
Kaplan-Meier plot within 30 days after liver transplantation. BNP: B-type natriuretic peptide.
In Cox proportional HR analysis for 30-day mortality, sex, MELD score, transfusion amount, and deltaBNP < 0 remained as significant variables, whereas, age, RCRI, transfusion amount, MELD score, deltaBNP < 0 was remained in the multivariable analysis of MACE (Figs. 3, 4).

Hazard ratios of univariable and multivariable analysis for 30-day mortality. RCRI: revised cardiac risk index, MELD: model for end-stage liver disease, pRBC: packed red blood cells transfused, PRS: post-reperfusion syndrome, BNP: B-type natriuretic peptide, CI: confidence interval. *P < 0.05 was considered statistically significant.

Odds ratios of univariable and multivariable analysis for major adverse cardiovascular events (MACE). BMI: body mass index, RCRI: revised cardiac risk index, MELD: model for end-stage liver disease, pRBC: packed red blood cells transfused, PRS: post-reperfusion syndrome, BNP: B-type natriuretic peptide, CI: confidence interval. *P < 0.05 was considered statistically significant.
DISCUSSION
In the current study, we hypothesized that transient decreases in postBNPPOD3 compared to pre-LT BNP (preBNP) level immediately after LT, i.e. deltaBNP < 0, favorable post-LT outcomes might be expected if the decrease in postBNPPOD3 could imply the improvement of cardiac status after LT. However, patients with deltaBNP < 0 after LT showed higher rates of 30-day mortality and MACE. We considered that these are attributed mainly to high preBNP level and high MELD score in patients with deltaBNP < 0. These results suggest that pre-LT high BNP level and severe liver disease status might be main determinant of poor 30-day outcomes irrespective of transient decrease of post-LT BNP level.
There are several potential explanations for these findings. One possibility is that there was more blood loss during LT in association with more severe liver disease, which implies greater loss of intravascular volume loss during LT. In fact, transfusion amount and MELD score were higher in those with deltaBNP < 0 in the current study.
Several studies demonstrated that the BNP increase after LT was markedly prevalent in advanced liver disease and was associated with increased risk of 30-day mortality and worse outcomes [4,11-13].
Kwon et al. [4] showed that strong correlates of preBNP > 400 pg/ml were MELD score, kidney failure, respiratory failure, and congestive HF. In contrast, the strongest correlate of postBNPPOD3 > 400 pg/mL increase was preBNP level, hyponatremia, MELD score, massive intraoperative transfusion, and intractable ascites. They specifically emphasized that patients with preBNP of 1,000-2,000 pg/ml and BNP > 2,000 pg/ml showed 14.8% and 25% 30-day post-LT mortalities.
In the current study showed that patients with deltaBNP < 0 had also higher preBNP level, therefore, patients with unusually high preBNP should examine their cardiac status again and modifiable risk factors thoroughly reevaluated before LT and should receive the optimal medical treatment.
One important point that deserves emphasis is that serial measurement of BNP is recommended for the risk stratification of mortality after LT regardless of our study results [12,14]. Rodseth et al. [12] also demonstrated that additional postoperative BNP measurement enhanced risk stratification for the composite outcomes of death or nonfatal myocardial infarction at 30 days and more than 180 days after noncardiac surgery compared with a preoperative BNP measurement alone.
The RCRI, which is recommended by many guideline committees, one of the most frequently validated models for perioperative cardiac risk stratification [5,15]. We adjusted this risk index to evaluate the 30-day mortality risk and MACE and then the deltaBNP < 0 remained significant. However, previous study showed that the 30- day mortality rates with RCRI of 1, 2, and ≥ 3 were 2.0%, 3.6%, and 4.7% after LT and revealed poor discriminative performance the RCRI in LT (C-statistic = 0.58) [4]. Nonetheless, adding preBNP, postBNPPOD3, and both BNP values to the RCRI improved reclassification analysis to 22.5%, 29.5%, and 33.1% of 30-day mortality prediction, respectively [4]. Therefore, the routine monitoring of peri-LT BNP provides risk stratification for early mortality as a useful biomarker in LT [16-19].
Our study has several limitations, first, prospective multicenter study is recommended because our study is retrospective. Secondly, we did not follow the BNP level further in patients with mortality and MACE, therefore further study is needed including serial BNP level monitoring. Thirdly, the patients with high preBNP (i.e, high DeltaBNP) may indicate higher possibility of cardiac diseases. Those with higher decrease of BNP levels may show higher mortality compared to those with normal or slightly increased preoperative BNP. Therefore, the result our study should be interpreted with caution. Further studies investigating the classification of cardiac status or patients with similar levels of preoperative BNP are needed in the near future.
In conclusion, DeltaBNP < 0 within the first 3 postoperative days is mainly attributed to pre-LT severe liver and cardiac disease status, therefore, transient decrease in BNP level after LT does not ensure favorable post-LT 30-day outcomes. These findings suggest that determinants of mortality and MACE are multiple and cannot reliably be predicted simply from changes in initial improvement of BNP, thereby special attention should also be paid to patients with deltaBNP < 0.
Notes
FUNDING
This research was supported partly by a grant from the Korea Health Technology R&D Project through the Korea Health Industry Development Institute, which is funded by the Ministry of Health & Welfare of the Republic of Korea (grant number: HI18C2383).
CONFLICTS OF INTEREST
No potential conflict of interest relevant to this article was reported.
DATA AVAILABILITY STATEMENT
OOO
AUTHOR CONTRIBUTIONS
Data curation: Gyu-Sam Hwang, Hye-Mee Kwon, Jae Hwan Kim, Sa-Jin Kang. Formal analysis: Gyu-Sam Hwang, Hye-Mee Kwon. Methodology: Gyu-Sam Hwang, Jae Hwan Kim, Sa-Jin Kang. Writing - original draft: Hye-Mee Kwon. Writing - review & editing: Gyu-Sam Hwang. Software: Hye-Mee Kwon. Supervision: Gyu-Sam Hwang.